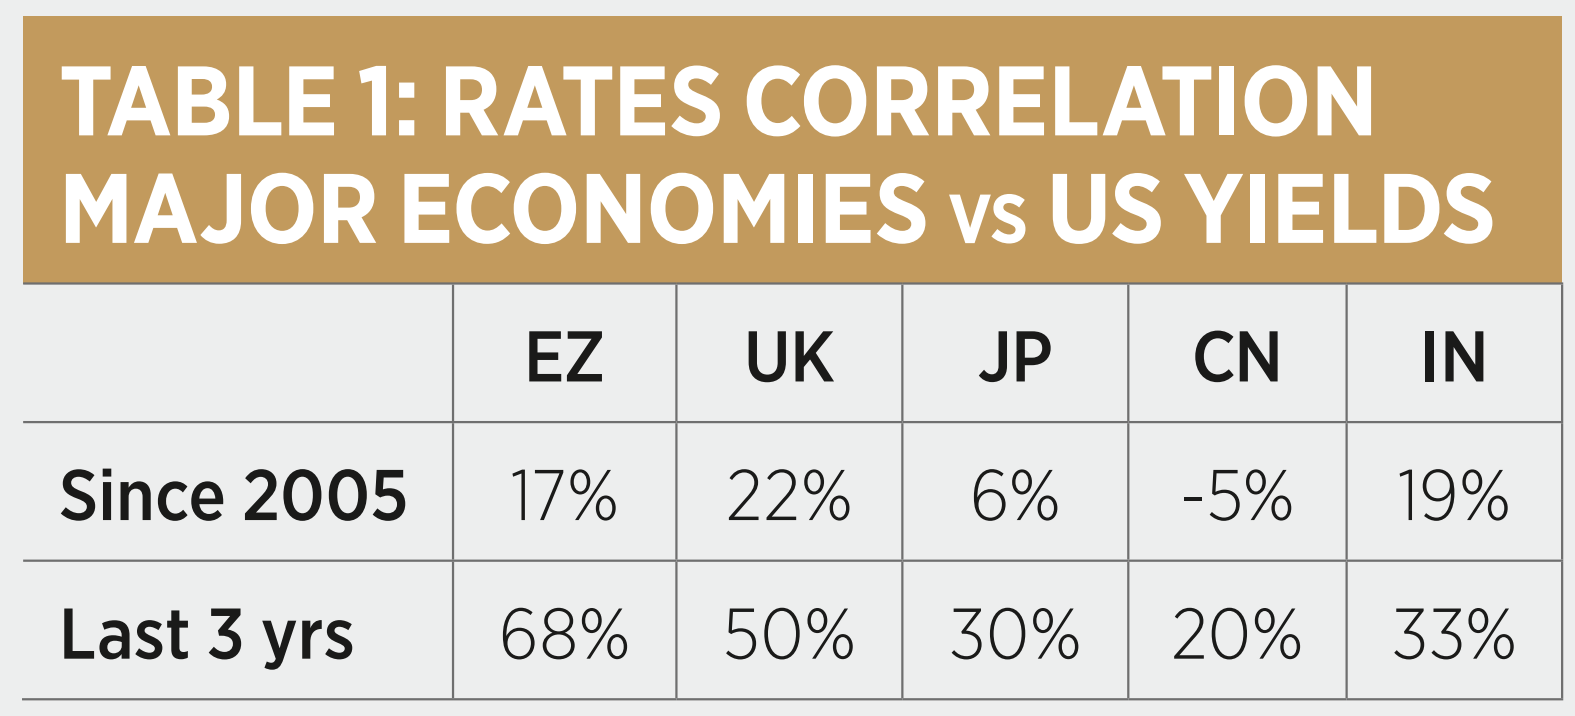
The resurgence of fixed income as an asset class is not without its perils. This year clearly marks the return of “beta” in fixed income, offering yields akin to equity dividend yields. However, investors must be mindful of significant and continued correlation across developed market rates and spreads. Hence, prudent fixed income allocators should not be lured by yield alone but keep sight of overall risk management.
At first glance, emerging market sovereign bonds denominated in local currency (EM local) are an unlikely contender for this role. Despite growing investor interest in some pockets of EM, such as China over the last decade and India more recently, most investors continue to focus on US dollar or euro-denominated debt.
Last year’s financial market shocks, ranging from war in Ukraine, continued policy-driven uncertainty in China and one of the steepest hiking cycles on record across developed markets, had a significant impact on EM local performance and volatility. In fact, EM local volatility since the turn of the decade is about 70% higher than it was since 2000.1
However, EM investors must not mistake the absolute level of risk for active risk, which is a more relevant risk factor when integrating EM local allocations into fixed income portfolios.
In fact, in 2023, investors may want to reconsider what drove them towards the asset classes in the aftermath of the Global Financial Crisis: yield pick-up, but more importantly, a significant level of diversification. Last year, traditional core exposures in government and investment-grade bonds have struggled to deliver on this front due to a record year for equity and bond correlation.
Local currency government bonds of key EM issuers such as China or India had a much better record – and that over many years.

Source: DWS International GmbH, Bloomberg, as of March 2023. Past performance is not a reliable indicator of future returns
Reaping the benefits of ‘de-globalisation’
The underlying driver of this is a growing economic decoupling of major EM growth poles from their DM peers. Looking ahead, investors may benefit from a continuation of this environment. China’s late 2022 shift to a new COVID-19 policy prepared the grounds for a growth recovery in 2023, supported by muted inflation and a comeback of consumption.2 Similarly, India benefits from a strong outlook driven by capex spending, strong exports and digitalisation. With a GDP that surpassed that of the UK in 2022, India is also on the bounds of becoming the world’s most populous country.3
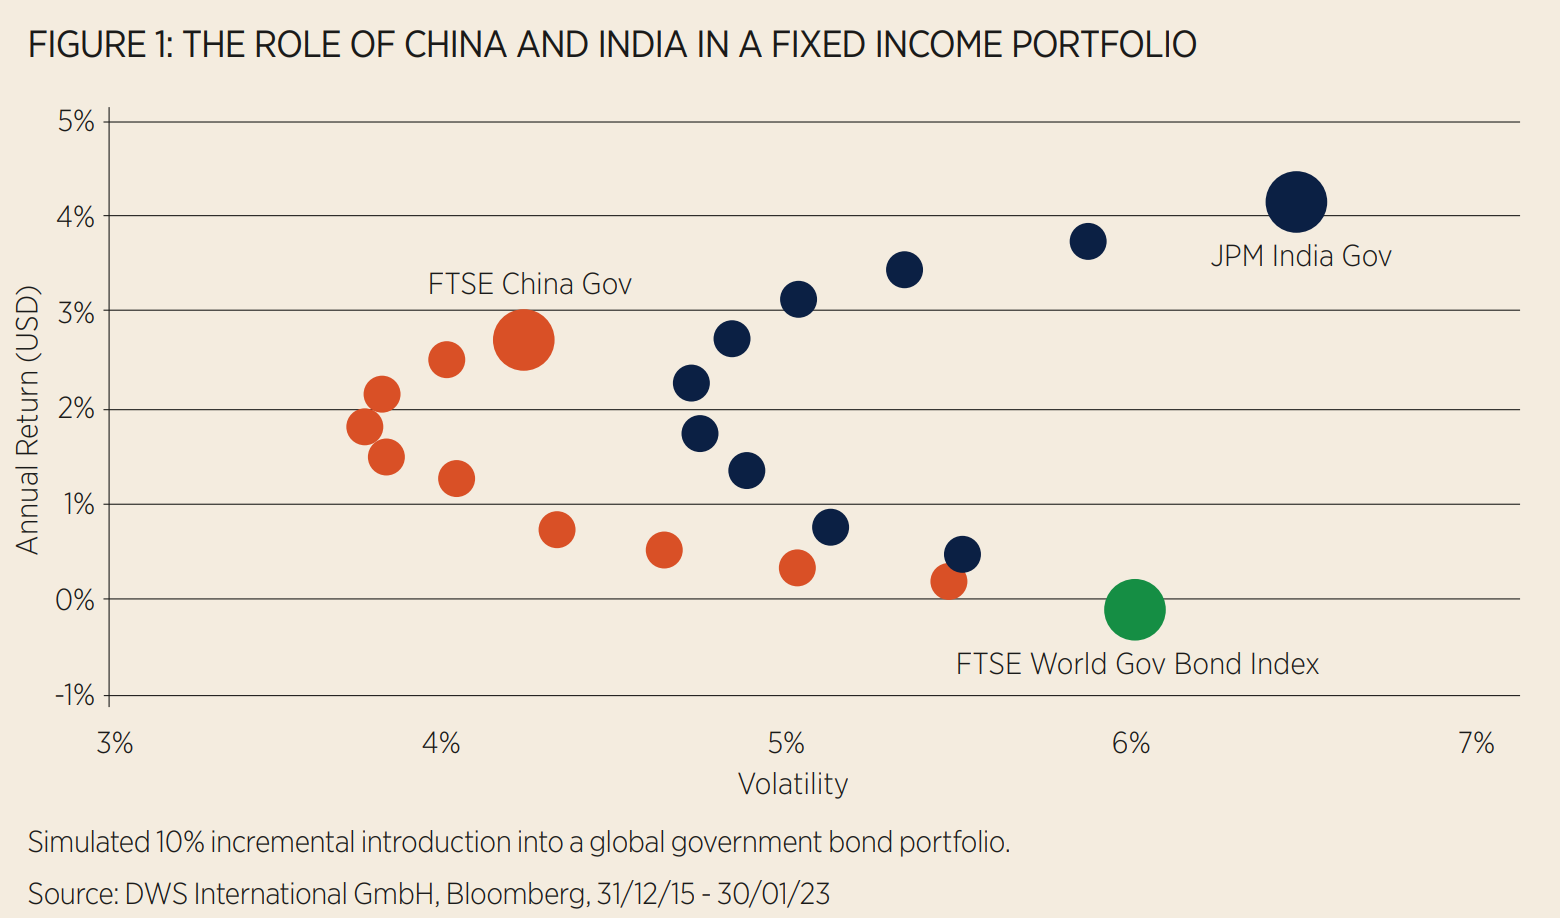
As Figure 1 illustrates, a moderate, integration of Chinese or Indian government bonds could make a meaningful difference – a 10% allocation to either would have reduced volatility of a global government bond portfolio by approximately 50bps.
When it comes to implementation, it is worth noting that financial market openness is no longer the main obstacle for investors in EM local.
Today, the investment toolkit available to ETF investors is granular and encompasses both single-country and broad solutions. Chinese government bonds – accessible to European investors since 2015 – have established themselves as a cornerstone of fixed income portfolios, recently peaking at €15bn in assets.4
In comparison, the opening of India lagged. However, both the introduction of market access to foreigners by the Reserve Bank of India in 2020 as well as raised prospects of inclusion in J.P. Morgan’s and Bloomberg’s flagship EM indices, tracked by over $300bn assets, put India on the map for sovereign bond investors. In fact, such inclusion alone could potentially trigger $20-30bn incremental flow into India.5

Getting to grips with the EM local asset class
Besides a screening of macroeconomic prospects and structural changes on the table for the asset classes, investors should explore the primary risk factors. In contrast to EM equities, which are primarily driven by equity beta, or US dollar-denominated EM bonds, where country credit risk accounts for roughly two-thirds of the total risk, the primary risk driver for EM local bonds has always been foreign exchange risk.
As of end of March 2023, FX-related risks account for a staggering 70% of overall risk6 – highlighting the significant challenges that arose from devaluation of local currencies in the past. Once peak US dollar strength and peak inflation are reached, those FX risks however could turn into tactical opportunity for investors. Moderating domestic inflation across most EM countries is only important reassuring indicator.
While highly volatile in nature, over longer horizons the EM local performance drag from currency devaluation averaged out at about 2.1% p.a.7
Prudent investors may want to account for such factors in the longer term. Furthermore, recent examples including Russia or Turkey serve as a stark reminder of the idiosyncratic nature of FX risks. It is for this reason that many investors have opted for broadly diversified index concepts such as the JP Morgan GBI-EM Global Diversified index, which encompasses 20 countries capped at 10% when venturing beyond IG-rated debt in CNY and INR.
By taking a diversified approach, investors may more effectively mitigate risk while still tapping into the same opportunities. Furthermore, constrained investors as well as those for whom EM equities are too risky may benefit from, positive correlation, at only a third of the equity and about half the volatility of equities.8
The global economic landscape is changing, and key EM countries like China or India are gradually decoupling from global economic cycles and creating new local centres of gravity. This trend is having a multiplying effect across EM, ranging from commodity-producing countries in Latin America to service-exporters in southeast Asia.
Today’s granular and competitively priced ETF offering presents investors with a unique passive toolkit to capitalise on growth opportunities in EM while at the same time mitigating risk through often underappreciated diversification effects.
This article first appeared in ETF Insider, ETF Stream's monthly ETF magazine for professional investors in Europe. To read the full magazine, click here.
1 DWS calculations, based on daily returns of the JP Morgan GBI-EM Global Diversified Index
2 DWS asset class experts forecast real GDP growth of over 5% in 2023
3 Based on data published by the World Economic Forum and the United Nations, respectively
4 Bloomberg, as of March 2023, UCITS ETF universe
5 Based on Goldman Sachs Research
6 Based on Bloomberg PORT, global risk model MAC 3
7 As obtained from comparing annualised returns in local currency vs USD for the JP Morgan GBI-EM Global Diversified Index over the period 02/12/02 – 31/03/23. Past performance is not indicative of future returns. Forecasts are not a reliable indicator of future performance.
8 Based on the daily returns over the last 5-year period
Disclaimer
DWS is the brand name of DWS Group GmbH & Co. KGaA and its subsidiaries under which they do business. The DWS legal entities offering products or services are specified in the relevant documentation. DWS, through DWS Group GmbH & Co. KGaA, its affiliated companies and its officers and employees (collectively “DWS”) are communicating this document in good faith and on the following basis.
This document is for information/discussion purposes only and does not constitute an offer, recommendation or solicitation to conclude a transaction and should not be treated as investment advice.
This document is intended to be a marketing communication, not a financial analysis. Accordingly, it may not comply with legal obligations requiring the impartiality of financial analysis or prohibiting trading prior to the publication of a financial analysis.
This document contains forward looking statements. Forward looking statements include, but are not limited to assumptions, estimates, projections, opinions, models and hypothetical performance analysis. No representation or warranty is made by DWS as to the reasonableness or completeness of such forward looking statements. Past performance is no guarantee of future results.
The information contained in this document is obtained from sources believed to be reliable. DWS does not guarantee the accuracy, completeness or fairness of such information. All third party data is copyrighted by and proprietary to the provider. DWS has no obligation to update, modify or amend this document or to otherwise notify the recipient in the event that any matter stated herein, or any opinion, projection, forecast or estimate set forth herein, changes or subsequently becomes inaccurate.
Investments are subject to various risks. Detailed information on risks is contained in the relevant offering documents.
No liability for any error or omission is accepted by DWS. Opinions and estimates may be changed without notice and involve a number of assumptions which may not prove valid.
DWS does not give taxation or legal advice.
This document may not be reproduced or circulated without DWS’s written authority.
This document is not directed to, or intended for distribution to or use by, any person or entity who is a citizen or resident of or located in any locality, state, country or other jurisdiction, including the United States, where such distribution, publication, availability or use would be contrary to law or regulation or which would subject DWS to any registration or licensing requirement within such jurisdiction not currently met within such jurisdiction. Persons into whose possession this document may come are required to inform themselves of, and to observe, such restrictions.
© 2022 DWS International GmbH /DWS Investment GmbH
In Hong Kong, this document is issued by DWS Investments Hong Kong Limited. The content of this document has not been reviewed by the Securities and Futures Commission.
© 2022 DWS Investments Hong Kong Limited
In Singapore, this document is issued by DWS Investments Singapore Limited. The content of this document has not been reviewed by the Monetary Authority of Singapore.
© 2022 DWS Investments Singapore Limited
In Australia, this document is issued by DWS Investments Australia Limited (ABN: 52 074 599 401) (AFSL 499640). The content of this document has not been reviewed by the Australian Securities and Investments Commission.
© 2022 DWS Investments Australia Limited


