Confluence of factors driving greater interest in environmental solutions
Investors and governments are seeking to increase sustainability across the global economy and change how conventional methods of extraction and consumption have underpinned economic growth since industrialisation.
Environmental solutions are expected to play a critical role in achieving this transition towards a more sustainable global economy and in building a more resilient future by reducing our likelihood of crossing irreversible environmental 'tipping points', such as significant climate change, groundwater depletion or biodiversity loss.
Environmental solutions include products, services or processes that minimise environmental damage by improving energy and material efficiency, developing more renewable energy capacity, reducing reliance on natural resources, and preventing pollution.
A targeted focus by governments on mitigating the worst possible impact of environmental breakdown has unlocked a series of policy measures to support the uptake of these solutions.
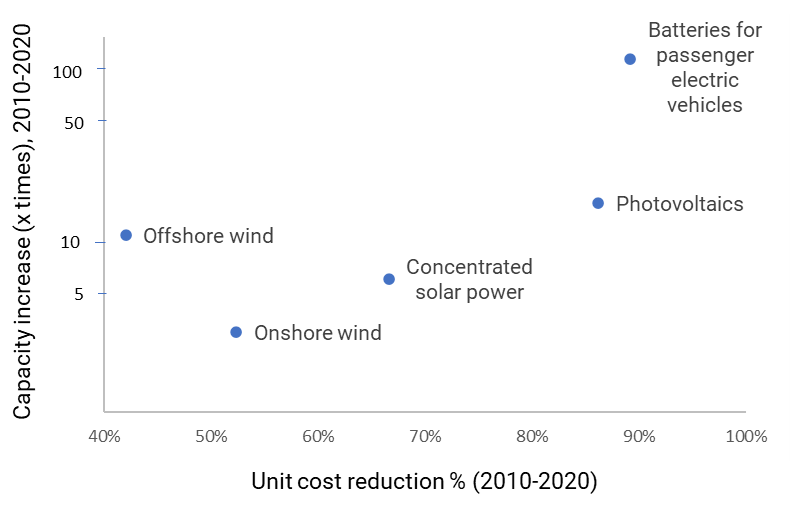
Environment-friendly industrial policies and financing options, such as the European Union’s (EU) LIFE program, the Inflation Reduction Act, the European Green Deal and the Net-Zero Industry Act, may enhance the commercial viability of projects involving environmental solutions. This could further drive down their cost (Chart 1) and thereby may accelerate investment flows and broaden their adoption.
Chart 1: Cost and adoption trend for select environmental opportunities

Source: IPCC
We have already seen a wave of new opportunities and a surge of technological innovation resulting from this transition with environmental solutions,as a broader category,projected to attract $5-10trn in investments per year by 2025. As capital flows toward environmental solutions, key questions for investors are:
How can I identify companies that provide environmental solutions?
Within this broad opportunity set, how can I pick a subset of themes associated with significant growth tailwinds due to their potential for mass disruption and adoption driven by environmental sustainability considerations?
Identifying environmental opportunity themes
To identify themes with opportunities for positive environmental contributions, we looked at MSCI ESG Research’s Environmental Impact themes8and publicly available taxonomies and frameworks developed by the EU and the United Nations Environment Program (UNEP).
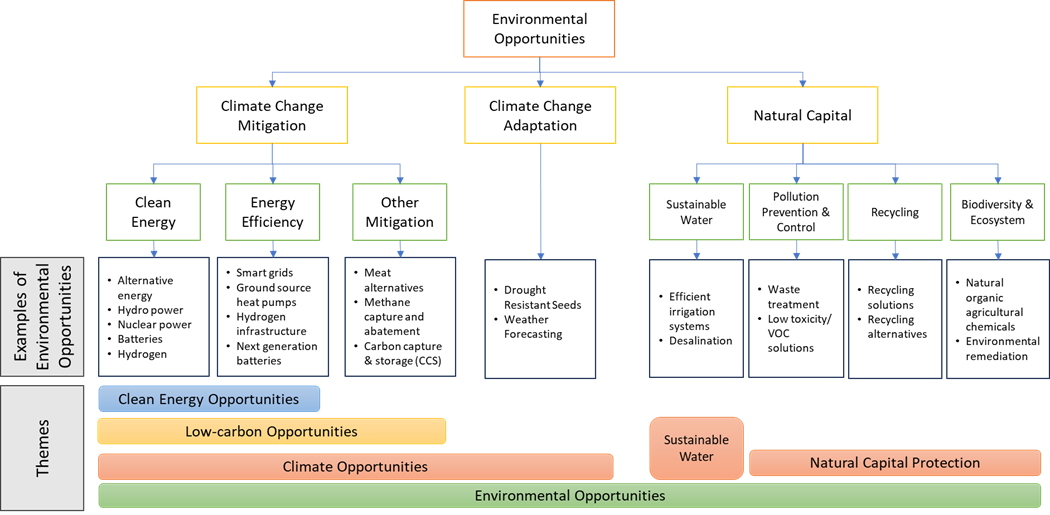
After understanding the commonalities and differences among these, we have proposed environmental opportunities themes (Chart 2) to help investors broadly identify business activities with potential for positive environmental contributions through mitigating greenhouse gas emissions,adapting to new climactic patterns or helping reduce adverse impacts on natural capital.
It also allows investors to focus on specific environmental opportunity trends by carving out a subset of themes such as clean energy and sustainable water.
Chart 2: Environmental opportunity themes

Source: MSCI
Selecting environmental opportunity themes positioned for significant growth tailwinds
While the above themes (Chart 2) offer a starting point for investors aiming to capitalise on subset of themes likely to experience significant growth tailwinds driven by environmental sustainability considerations, simply relying on an extensive list may have several pitfalls for them as not all environmental solutions may offer similar growth opportunities. For example:
Some technologies have already grown close to their market saturation.For instance, LED lightbulbs may have experienced high growth in the past but could be near their market saturation phase by now as their deployment become widespread.10
Some environmental solutions may not be positioned to grow significantly if they are not aligned with broader trends. For example, fossil fuel-based cogeneration is not aligned with the global goal of a zero-carbon world and thus, in a scenario of transition to a zero-carbon world, it may not be positioned to grow at the same rate as that of solutions aligned with a zero-carbon world.
Finally, it is crucial for investors to distinguish between solution users and solution providers as they are exposed to different sets of growth opportunities, though both are generally considered by taxonomies as environmentally sustainable economic activities.
To identify a subset of themes likely to experience significant growth tailwinds and have high potential for mass disruption and adoption, we discuss two main analytical dimensions investors can adopt: One is defining the scale of potential adoption the environmental solution could have in the real economy; the other is determining the nature of potential disruption the solution will bring to different sectors in the value chain. We go into detail on both questions below.
Scale of potential adoption
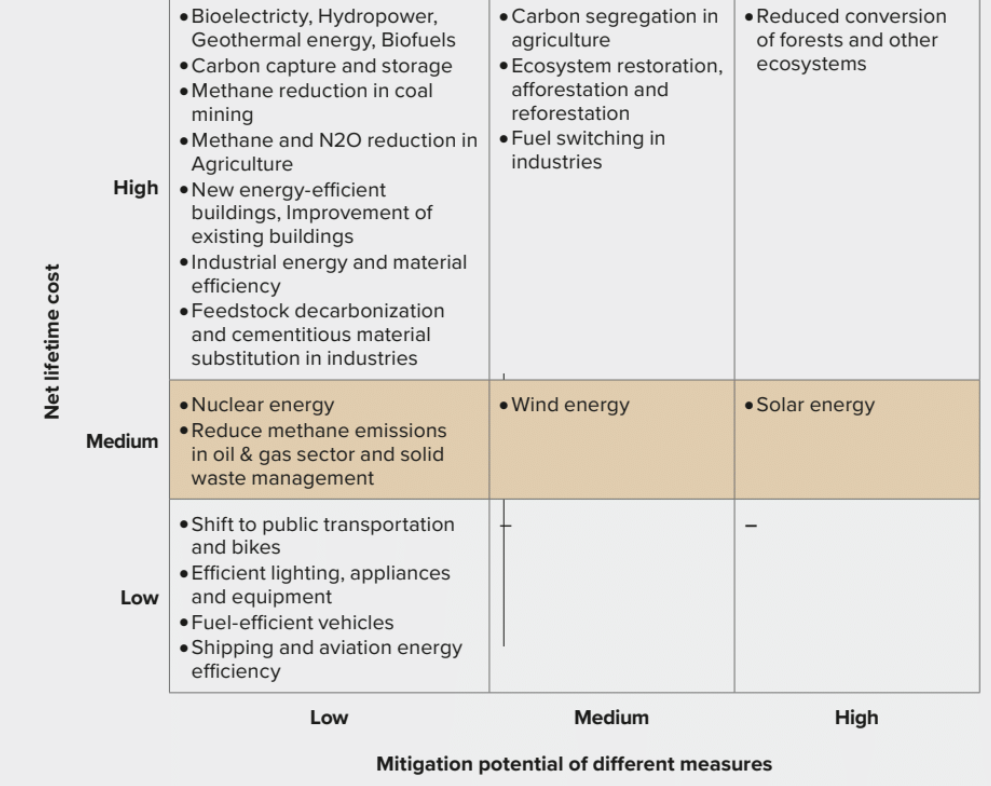
The first dimension–the scale of potential adoption–has two main components. The first is how well a technology solves the problem it was built to address. For example, solar PV, and wind turbines, which don’t produce greenhouse gas emissions through their operations, solve the problem of decarbonising electricity production extremely well (Chart 3).
For these power sources, this is true both in an absolute sense and from an opportunity cost perspective, where alternatives are high emitting options like combined cycle gas turbines (CCGT), oil-fired generators and coal-fired plants.
Also,considering enabling technologies like high voltage transmission lines, utility scale battery storage, and upgrades to the electricity grid to deploy renewable energy can ensure investors capture opportunities across the renewable power value chain.
Similarly, new agricultural technologies that are more natural resource efficient and reduce pesticide use, for example, may have the potential for widespread adoption as well. The second component of the scale of potential adoption is the remaining runway for the technology’s room to grow.
What is the size of the total remaining addressable market? Some markets are already saturated: The use of LED lightbulbs grew exponentially over the past two decades and the bulbs are now ubiquitous.
They solve their problem well–LED lightbulbs are much more energy efficient than previously conventional alternatives–but large part of the market has already been addressed with remaining addressable market shrinking every year.
On its own, fast growth does not mean a small future market:technologies such as solar PV, wind turbines, and electric batteries have seen widespread adoption globally in the last decades (Chart 1) but growing energy demand and the large amount of emissions-intensive electricity generation still in use suggest these widely used technologies still have significant room for growth.
Chart 3: Relative mitigation potential and cost of selected climate solutions

Source: IPCC
Nature of potential disruption
After the scale of potential impact, the second analytical dimension is the nature of potential disruption that environmental solutions will bring to different sectors in the value chain. For instance, a typical product value chain may contain both providers and users of an environmental solution, however these two entities in the value chain could be exposed to different levels of growth opportunities.
To explain this, we refer to MSCI’s Low Carbon Transition Categories which are defined based on the nature of transition different companies are likely to experience in a low carbon transition scenario (Chart 4).
Here solution users are generally the businesses which currently have carbon intensive operations or products (e.g. steel, cement, utilities and automobiles), and thus may be undergoing operational or product transition, as applicable, driven by climate considerations.
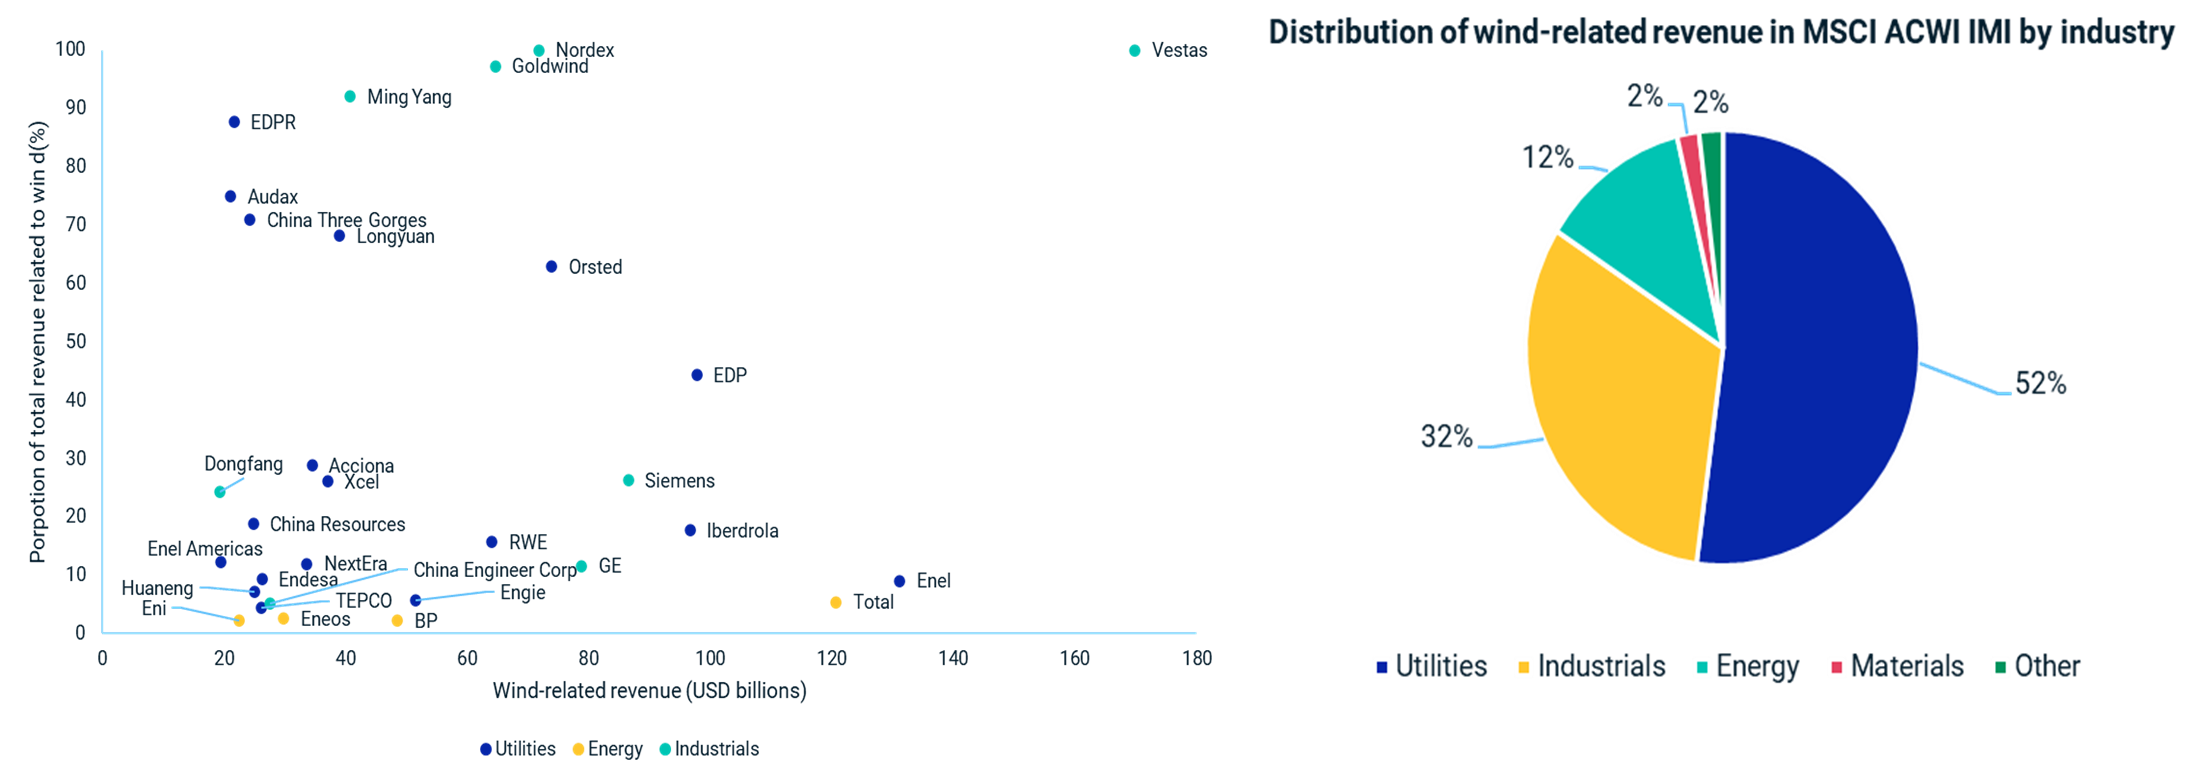
Such businesses may face headwinds in the form of carbon pricing risk in the low-carbon scenarios. In contrast, solution providers such as wind turbine manufacturers may face greater growth tailwinds due to increased demand for their products and services in a low carbon transition scenario (Chart 5).
In earlier research, we analysed the earnings growth of companies with different low-carbon-transition risk profiles. We found that, over the study period, Solutions LCT category, which includes low-carbon solutions providers, had higher earnings growth compared to Asset Stranding, Product Transition and Operational Transition LCT categories.
Classifying companies into provider and/or users of an environmental solution thus may help investors in identifying companies likely to experience significant growth tailwinds.
Chart 4: MSCI's Low Carbon Transition Categories
LCT Category | Description |
|---|---|
Asset Stranding | Potential to experience stranding of physical or natural assets due to regulatory, market and technological forces arising from low- carbon transition. |
Product Transition | Reduced demand for carbon-intensive products and services; winners and losers are defined by the ability to shift product portfolio to low-carbon products. |
Operational Transition | Increased operational and capital cost due to carbon taxes and investment in carbon emissions mitigation measures, leading to lower profitability of companies. |
Neutral | Limited exposure to low-carbon transition risk; companies could face physical risk or indirect exposure to transition risk via lending, investment operations. |
Solutions | Potential to benefit through the growth of low-carbon products and services. |
Source: MSCI
Chart 5: Some wind turbine manufacturers generate more wind-related revenue than utilities

Source: MSCI
An assessment of different environmental solutions using the two analyses above can help investors compare the strength of potential growth tailwinds due to the transition towards a more sustainable global economy.
For example, renewable energy technologies such as PV cells have high potential for future adoption and can bring massive transformation to the power generation sector in terms of avoided carbon emissions. Favourable assessment on both dimensions makes PV cells a technology with potentially higher growth tailwinds.
On the other hand,in this context natural gas-based co-generation may face headwinds as it would not be aligned with a net-zero emissions scenario, and has only incremental advantage over existing options in terms of its climate impact.
Conclusions
The set of environmental opportunity themes proposed in this report may help investors in identifying business activities with a potential for positive environmental contribution.
Further, two analytical dimensions discussed, the scale of potential adoption and the nature of potential disruption, can help them understand the strength of growth tailwinds supporting a given environmental opportunity.
This approach may support investors in differentiating potential leader companies, which are exposed to significant growth tailwinds, from laggard companies in a given set of companies with exposure to environmental opportunities.
This article first appeared in ETF Insider, ETF Stream's monthly ETF magazine for professional investors in Europe. To read the full edition, click here.
Notice and disclaimer
The information contained herein (the “Information”) may not be reproduced or redisseminated in whole or in part without prior written permission from MSCI. The Information may not be used to verify or correct other data, to create any derivative works, to create indexes, risk models, or analytics, or in connection with issuing, offering, sponsoring, managing or marketing any securities, portfolios, financial products or other investment vehicles. Historical data and analysis should not be taken as an indication or guarantee of any future performance, analysis, forecast or prediction. None of the Information or MSCI index or other product or service constitutes an offer to buy or sell, or a promotion or recommendation of, any security, financial instrument or product or trading strategy. Further, none of the Information or any MSCI index is intended to constitute investment advice or a recommendation to make (or refrain from making) any kind of investment decision and may not be relied on as such. MSCI ESG and climate ratings, research and data are produced by MSCI ESG Research LLC, a subsidiary of MSCI Inc. MSCI ESG Indexes, Analytics and Real Estate are products of MSCI Inc. that utilize information from MSCI ESG Research LLC. MSCI Indexes are administered by MSCI Limited (UK) and MSCI Deutschland GmbH. The Information is provided “as is” and the user of the Information assumes the entire risk of any use it may make or permit to be made of the Information. NONE OF MSCI INC. OR ANY OF ITS SUBSIDIARIES OR ITS OR THEIR DIRECT OR INDIRECT SUPPLIERS OR ANY THIRD PARTY INVOLVED IN MAKING OR COMPILING THE INFORMATION (EACH, AN “INFORMATION PROVIDER”) MAKES ANY WARRANTIES OR REPRESENTATIONS AND, TO THE MAXIMUM EXTENT PERMITTED BY LAW, EACH INFORMATION PROVIDER HEREBY EXPRESSLY DISCLAIMS ALL IMPLIEDWARRANTIES, INCLUDING WARRANTIES OF MERCHANTABILITY AND FITNESS FOR A PARTICULAR PURPOSE. WITHOUT LIMITING ANY OF THE FOREGOING AND TO THE MAXIMUM EXTENT PERMITTED BY LAW, IN NO EVENT SHALL ANY OF THE INFORMATION PROVIDERS HAVE ANY LIABILITY REGARDING ANY OF THE INFORMATION FOR ANY DIRECT, INDIRECT, SPECIAL, PUNITIVE, CONSEQUENTIAL (INCLUDING LOST PROFITS) OR ANY OTHER DAMAGES EVEN IF NOTIFIED OF THE POSSIBILITY OF SUCH DAMAGES. The foregoing shall not exclude or limit any liability that may not by applicable law be excluded or limited. Privacy notice: For information about how MSCI collects and uses personal data, please refer to our Privacy Notice at https://www.msci.com/privacy-pledge.


