The use of factor-based strategies for investing in fixed income has gained in popularity recently,
with benchmarks and associated ETFs
pursing exposure to such factors as value, quality and carry and roll-down in the search of increased returns.
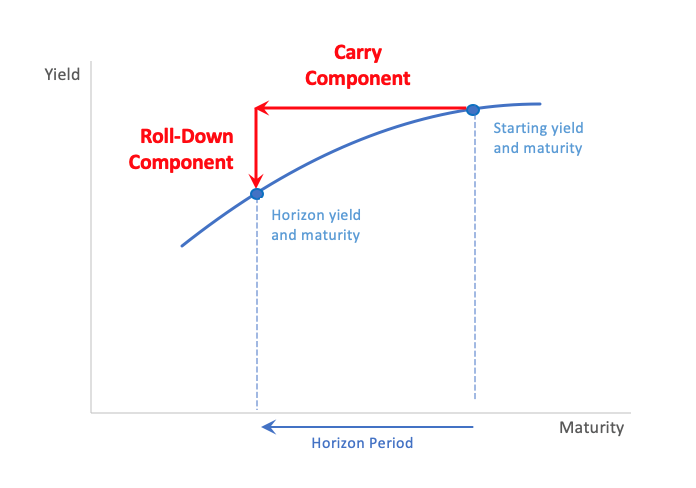
Carry and roll-down strategies are constructed by presuming that yields and spreads will remain unchanged over a horizon period of, say, a month and then buying the portfolio that will maximise return under this presumption; usually subject to constraints such as matching the duration of the underlying market.
Index providers create benchmarks from chaining together strategies rebalanced periodically: usually every month in line with the rebalance frequency of the underlying index.
Typically the optimal carry and roll-down portfolios are made up of investing in barbells of long and short-maturity bonds. In a similar way to how a currency trader often feels that spot exchange rates are better predictors of the market than forward rates, the idea of a carry and roll-down strategy is that the current yield curve is a good predictor of the future curve.
Projected returns are maximised by capturing the ideal blend of higher, longer yields that makes up the “carry” component, and capital gains through yields falling as the bond moves closer to maturity: the “roll-down” component. At least that’s the idea in a “normal”, positively sloping yield curve environment.
Today, however, it is a rather different story with many developed government yield curves close to flat. In the US the 1-10 year spread is currently 46 basis points after being slightly inverted in August last year. In Germany, the spread is 7bp and in the UK 13bp. Does this mean that carry and roll-down strategies are still sensible?

Well, possibly. Japan, for example, has had an almost-flat government curve for many years now, and yet carry and roll-down strategies have performed well there. It’s safe to say the spot curve has indeed been a reasonable predictor of the curve in the near future. But what’s going on behind the scenes when the curve is nearly flat may not be fully appreciated by all investors.
The strategies are determined by optimisers which find the portfolio that will provide the highest return. As already mentioned, such a strategy often turns out to be a barbell. But if the curve is flat then any barbell (indeed any portfolio that satisfies the constraints) will be equally optimal.
In practice, the curve will not be exactly flat and there will still be a single, optimal portfolio. But the fact that many other, potentially quite different, portfolios are almost as optimal can easily be lost in the wash. Perhaps if the optimisation had been done a day earlier, or a day later, investors could be buying a markedly different set of bonds.
Smart beta fixed income – tool or threat?
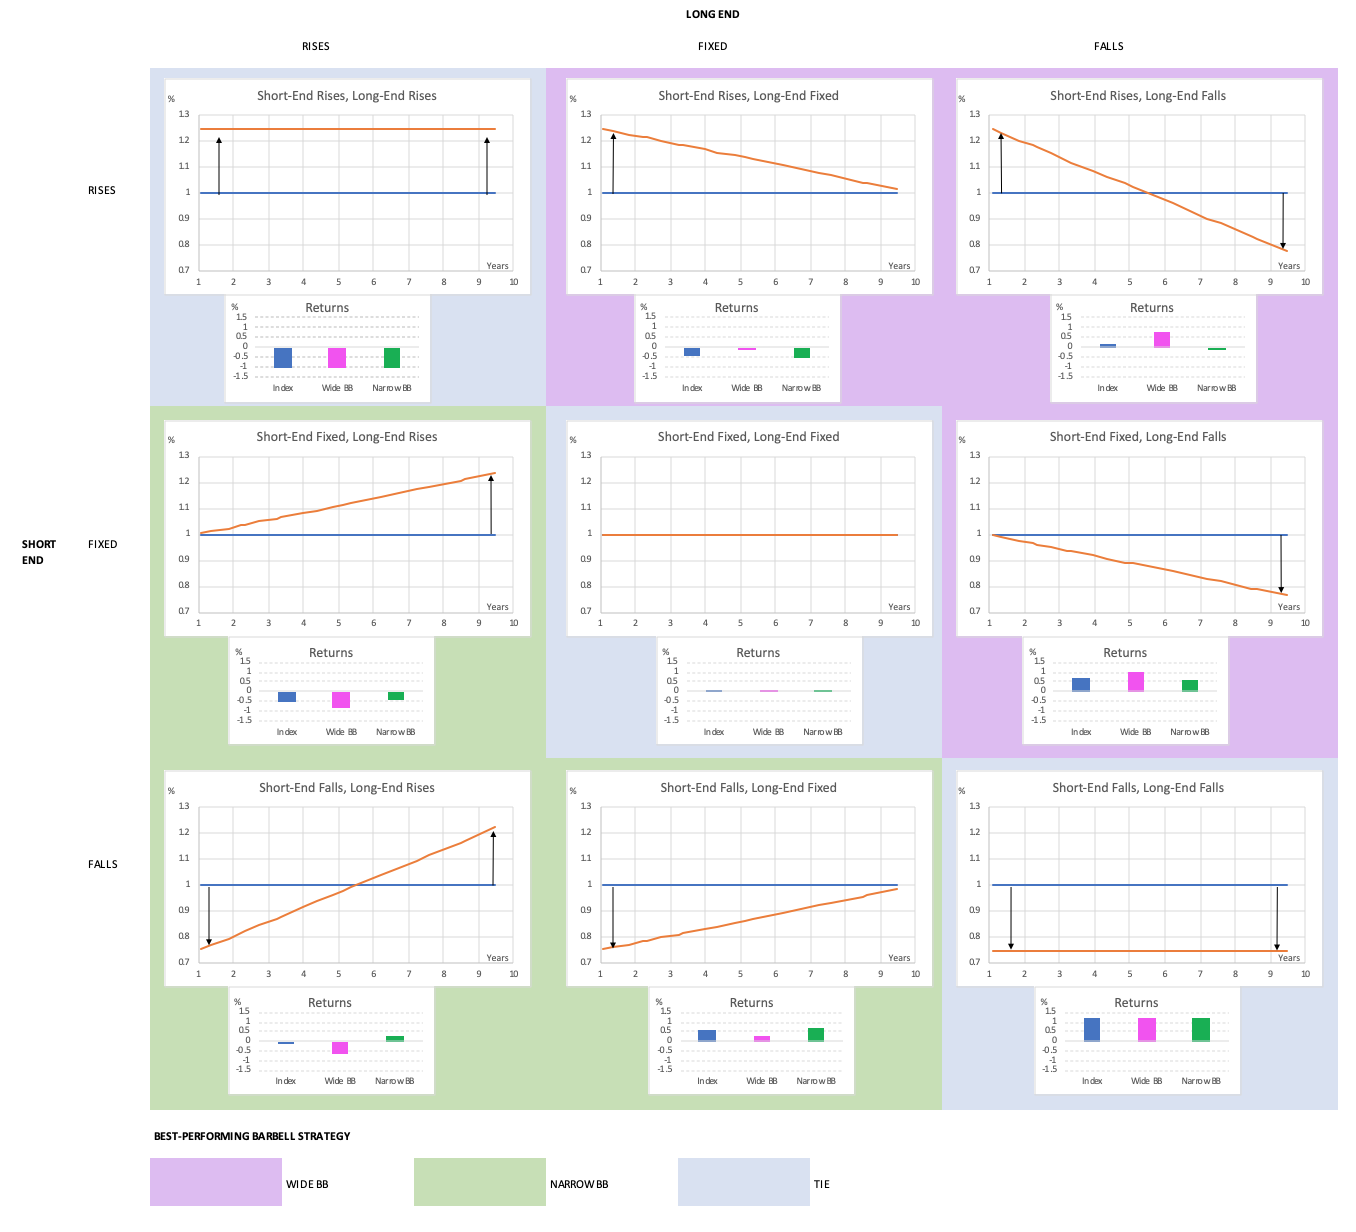
Consider the impact on two barbell strategies, one wide and one narrow, of different market moves. In the examples below the two strategies have the same durations as the underlying market, which I have modelled on recent outstanding issues from the 1-10 year UK gilt market, though similar results are obtained using the US and other developed bond markets which are similarly well-populated across this maturity range.
Taking a starting point of a flat yield curve of 1%, for illustration, the charts below show the returns from the underlying index and the barbell strategies when the short and long ends of the curve are shifted -25, 0 and +25 basis points with intermediate points linearly interpolated.
Along the diagonal of the matrix where the curve makes a parallel shift the two strategies perform similarly. Below the diagonal, the narrow barbell outperforms the wide one. Above the diagonal, the opposite is the case.

Illustrative index and barbell performance comparisons
Of course, other types of moves and contortions of the yield curve are possible, and it’s certainly not the case that the moves depicted here should be regarded as equally likely.
Nevertheless, the point is that if the curve does not stay still – as the carry strategy “hopes” – then the consequences of the strategy departing from this may not be as expected. From a risk management perspective, this is far from ideal. Structuring your investments such that if such-and-such events happen then you may lose on some of them but not on others is the essence of diversification.
It is important to understand a portfolio’s “failure modes” to control downside risks. (Sure, carry and roll-down investments may be in self-contained portfolios or ETFs, but would you be investing all your money in one such strategy?)
Including transaction costs in the optimisation can reduce turnover and prevent portfolios from changing drastically from month to month, but this comes at a cost of increased complexity. For example: if an index includes transaction costs, and also includes constraints such that allocations are made to maturity sectors rather than individual bonds, then keeping track of bonds moving from one sector to another at a rebalancing makes for a much fiddlier problem.
There are also the matters of obtaining accurate bid-offer spreads, and that a new investor into a fund using such a pre-existing index may end up following a strategy which is slightly sub-optimal for them.
Moorgate Benchmarks’ Parker: Bond indices – why smart beta is the way to go
In an environment where yield curves are changing little then carry and roll-down strategies which embrace this as a starting presumption are as appealing as ever. But, as and when the curves are so close to flat that optimal portfolios may not be that optimal, and particularly if yields are not so static, then it is as well to pay attention to the finer details of that portfolio.
Alan Cubbon is a consultant at Moorgate Benchmarks and former managing director at FTSE Russell
Sign up to ETF Stream’s weekly email here


