When markets are falling and may have further to slide, minimum volatility ETFs can seem attractive, but could quality ETFs be a better bet?
Minimum volatility is designed to do well in volatile/downward trending markets while quality offers exposure to quality companies chosen using a range of criteria such as return on capital and cash flow.
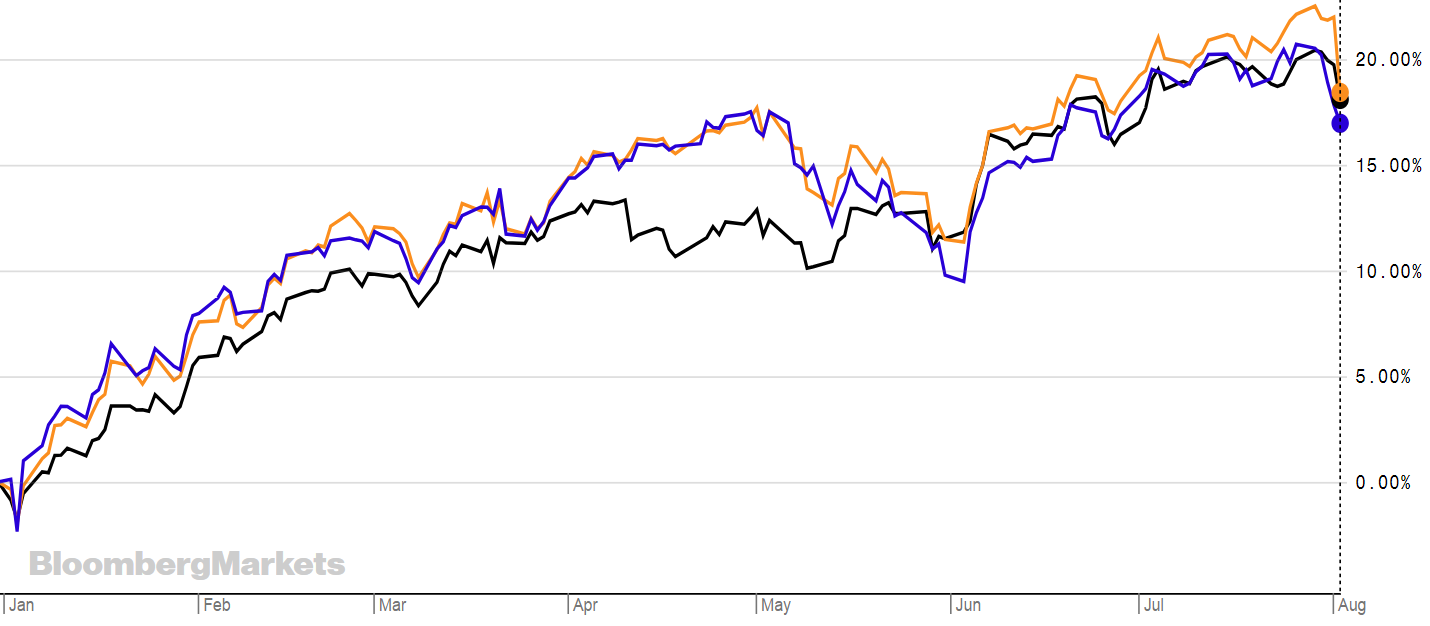
The chart below shows the Xtrackers MSCI USA Minimum Volatility UCITS ETF (XMVU) in black, the Fidelity US Quality Income UCITS ETF (FUSA) in orange and the S&P500 in blue. XMVU has returned 20.15%, FUSA 18.44%, while the S&P 500 has returned 16.96% year to date.
Anthony Kruger, iShares EMEA head of smart beta at BlackRock, told ETF Stream: "Looking forward, we hold a positive view on defensive factors including quality and minimum volatility.
"These two factors have historically performed well during economic slowdowns. Quality is arguably slightly more attractive due to its longer running positive price momentum."
How the quality smart beta factor works depends on the index. For example, XMVU tracks the MSCI USA Minimum Volatility Index, MSCI’s quality indexes choose their high-quality stocks by considering return on equity, debt to equity and earnings variability.
The table below shows how the quality stocks are screened at the various index firms.
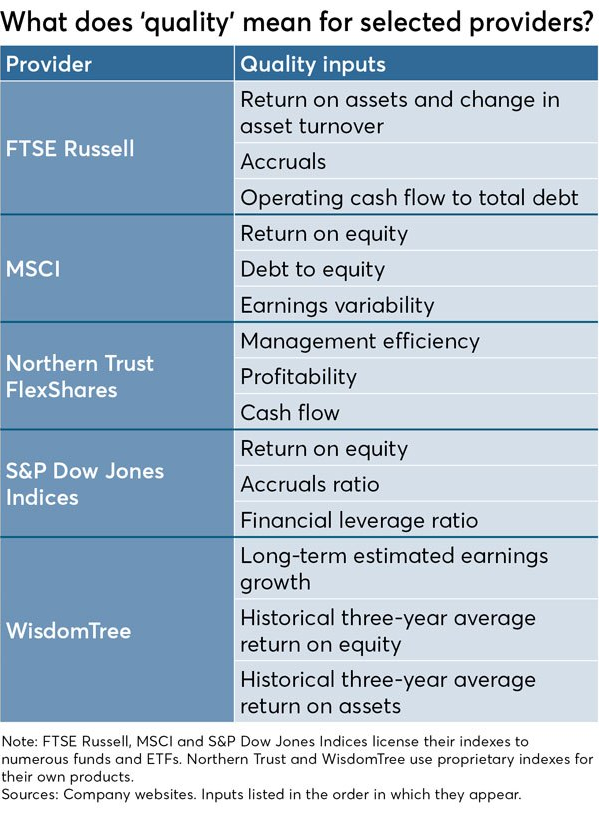
Source: Financial-Planning
Adam Laird, head of ETF strategy, Northern Europe at Lyxor, said: “In theory choosing quality stocks and holding them long term is a good idea.”
However, something to bear in mind is that a similar argument has been made for value stocks which outperformed last century but have disappointed in the last 10-15 years. There are concerns that the value in smart beta has started to disappoint.
“But there are still good reasons to buy it,” Laird explained. “especially if you want income. Good businesses tend to generate good income and if this is the type of investment you want then quality smart beta ETFs are a good way to go.”
The best way to use smart beta is if you have a conviction or an objective to fulfil. For example, income or protection. In this sense smart beta is one of the areas in ETFs where investors appear to know what strategy they want to take, they just may not always know how to get it.
When picking your ETF, it pays to know what is in the underlying index. One of the best performing ETFs year to date is the UBS ETF-Factor MSCI EMU Quality UCITS ETF, which has returned 21.44%. It has a TER of 0.28% and tracks the MSCI EMU Quality Total Return Net index.
MSCI stated: "The MSCI EMU Quality index is based on MSCI EMU index, its parent index, which includes large and mid-cap stocks across the 10 Developed Markets countries in the European Economic and Monetary Union (EMU)*.
"The index aims to capture the performance of quality growth stocks by identifying stocks with high quality scores based on three main fundamental variables: high return on equity (ROE), stable year-over-year earnings growth and low financial leverage."
The returns on quality stocks is often delivered via income and high paying dividends.
“I would argue for quality over min vol in the longer term because it has a better chance of continuing to do well,” Laird said. “But it is good to remember that none of this is without risk.
"There is still equity risk and if markets are going down it does not mean a smart beta quality – or min vol – will not either. You just hope that it will not be quite as bad as the less high quality or volatile stocks."
There is also the yield trap to consider, where a company promises dividends but cannot actually pay up. The quality screen looks to get rid of these companies by trying to anticipate how much risk a business can take before it defaults.
Carillion paid a full dividend about 6 months before it went under, reminds Peter Sleep, senior portfolio manager at 7IM.
The table below shows some of the quality factor ETFs on the London Stock Exchange with the index they track.
ZIUS
FEMQ
FUSA
FGQD
SGQG
ETFYTD RTNTERINDEXBMO MSCI USA Income Leaders UCITS ETF15.26%0.25%MSCI USA Select Quality Yield NR USDFidelity Emerging Markets Quality Income UCITS ETF10.50%0.50%Fidelity Emerging Markets Quality Income IndexFidelity US Quality Income UCITS ETF18.44%0.30%Fidelity US Quality Income Index.Fidelity Global Quality Income UCITS ETF21.43%0.4%Fidelity Global Quality Income IndexLyxor SG European Quality Income NTR UCITS ETF12.05%0.45%SG European Quality Income Index
XMGD
Expense Ratio0.45%
XQUA
Expense Ratio0.5%
MAJQ
UD04
XMDU
Expense Ratio0.35%
XD3E
Expense Ratio0.3%
WQDS
EQDS
IEQD
Xtrackers Morningstar Global Quality Dividend UCITS ETF10.81%Current Mgmt Fee0.35%Morningstar Developed Markets Dividend Yield Focus IndexXtrackers USD Emerging Markets Bond Quality Weighted UCITS ETF11.49%Current Mgmt Fee0.40%Markit iBoxx USD Emerging Markets Sovereigns Quality Weighted IndexMarket Access iSTOXX MUTB Japan Quality 150 Index UCITS ETF16.30%0.50%iSTOXX MUTB Japan Quality 150 IndexUBS ETF-Factor MSCI EMU Quality UCITS ETF21.44%0.28%MSCI EMU Quality Total Return NetXtrackers Morningstar US Quality Dividend UCITS ETF11.59%Current Mgmt Fee0.25%Morningstar® US Dividend Yield Focus UCITS IndexXtrackers Euro Stoxx Quality Dividend UCITS ETF12.45%Current Mgmt Fee0.20%Euro STOXX Quality Dividend 50 Total Return Net IndexiShares MSCI World Quality Dividend UCITS ETF17.20%0.38%MSCI World High Dividend Yield IndexiShares MSCI Europe Quality Dividend UCITS ETF12.30%0.28%MSCI Europe High Dividend Yield 4% Issuer Capped IndexiShares Edge MSCI Europe Quality Factor UCITS ETF15.61%0.25%MSCI Europe Sector Neutral Quality Index


