As ETFs become more widely adopted across Europe, more sophisticated and innovative products come to market. Thematic technology is just one of these innovative themes which investors are demanding, and sure enough,
.
Disruptive technology is extremely relevant right now as we are constantly seeing new advances within artificial intelligence, cloud technology, self-driving cars and blockchain, to name a few.
One area which investors are particularly excited about is robotics and automation. Legal & General Investment Management (LGIM) specialises on thematic ETFs having recently expanded its offering at the beginning of July, ETF Stream revealed. One of its largest ETFs in terms of assets is its global robotics and automation ETF, but how does it fare against industry giants BlackRock?
ETFL&G ROBO Global Robotics and Automation UCITS ETF (ROBO)iShares Robotics and Automation UCITS ETF (RBOT)AUM$903.7m$1.99bnBenchmarkROBO Global Robotics and Automation UCITS IndexiSTOXX® FactSet Automation & Robotics IndexExpense ratio0.8%0.4%Inception date27/10/201412/09/2016
Investment Strategy
LGIM partnered with Robo Global for the launch of ROBO which has 88 holdings. The top 10 of said holdings account for 16.8% of the fund as well as 47.3% of the constituents being based in the US.
With the States being the largest geography exposure, Asian exposure remains relatively low. Japan is the second largest exposure with 23.5% and then its Taiwan with 5.5% and South Korea with 1.6%.
It is a similar story with RBOT as the largest exposure again is the US with 45.9%, ahead of Japan with 21.6% and then Taiwan with 7.5%. The main differences being China does not appear in ROBO’s top 10 countries but does in RBOT’s with 3.2%, the sixth largest exposure.
Investing in US equity: Lyxor’s low fee vs iShares’ liquidity
There are some key differences in their sector exposures as well. ROBO’s largest sector exposure is industrials with 49.7% whereas RBOT’s exposure for the same sector is only 28.0%, the second largest behind informational technology with 65.8%.
RBOT’s remaining sector exposures are less than 3% however ROBO has one other exposure greater than 2% which is healthcare and makes up 7.4% of the fund.
Cost and tradability
Immediately, the noticeable difference between the two ETFs is the two expense ratios. ROBO’s 0.8% management fee is twice that of RBOT’s fee of 0.4%. To add some perspective on that, any investor investing $1,000,000 into these ETFs would be charged $8,000 for ROBO and $4,000 for RBOT. Therefore, we calculate LGIM makes $7.2m in revenue a year from ROBO's fee with iShares making just under $8m from RBOT's fees.
Both ETFs have been trading at a discount, on average, for the last 52 weeks. ROBO’s average premium is -0.15%, nearly twice that of RBOT’s at -0.08%. However, ROBO is currently trading at a discount of 0.74%, as at 15 July, making it cheap to buy but also means current holders would be selling extremely low.
Performance
ROBO’s and RBOT’s holdings do differ significantly and therefore so do their returns. Year-to-date, RBOT has produced the greater performance of 22.5% whereas ROBO has returned 18.9% for the same period.

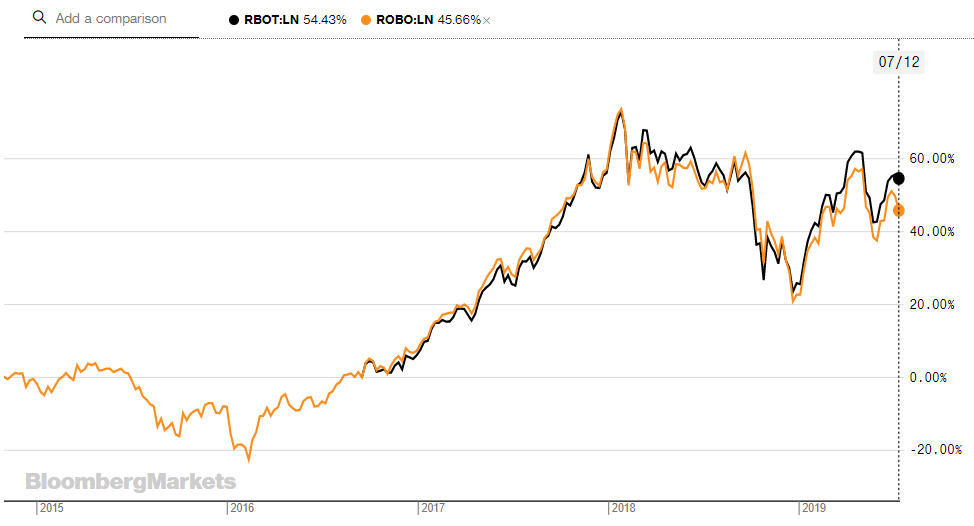
ROBO's and RBOT's five-year performance - Source: Bloomberg
ROBO launched in Q4 2014 but had an underwhelming start. By early 2016, the ETF had losses of over 22%. By the time RBOT launched in September 2016, ROBO managed to rectify its losses and broke even once again.
Both ETFs had a significantly positive 2017, producing returns over 70% between September 2016 and January. Pushing three years on since RBOT’s launch, it has only started to outperform ROBO this year. RBOT has produced returns of 54.4% since its launch whereas ROBO has only offered 45.7% for the same period.
Risk
RBOT has 136 holdings, significantly greater than ROBO’s 88 making it the more diversified portfolio. Due to the difference in the number of holdings, the top 10 constituents of the funds take up different proportions. ROBO’s top 10 makes up 16.8% of the ETF whereas RBOT’s top 10 only makes up 8.5%.
Conclusion
Head to head, these two ETFs may track similar industries but differ quite significantly. With iShares’ market dominance, RBOT has pulled in nearly $2bn worth of assets since its launch at the end of 2016, whereas LGIM’s ROBO has just over $900m in assets under management but is two years older.
While RBOT offers greater returns, smaller fees and minimal discount, LGIM is more specialised on the thematic area. With the recent expansion of LGIM’s thematic range, the company is working closely with the likes of ROBO Global and Global Water Intelligence to provide industry insights. ROBO is rebalanced on a quarterly basis whereas RBOT is done annually.
Once markets become more volatile, it would suggest LGIM’s ROBO would be more reactive to the technology industry’s movements and performances.


