In a market where the only certainty is uncertainty, many investors view global equity exposure as the necessary bedrock for a diversified core portfolio – and the two largest asset managers BlackRock and Vanguard reign supreme in the arena of global ETFs.
Some 18 years after the first world ETF launched in Europe, more than 100 now offer different flavours of global equity exposure with the top five alone housing $101.1bn assets under management (AUM).
While diversification across thousands of equities provides benefits for long-term asset allocation, doing so within a vehicle trading intraday via a single transaction is no mean feat for ETF issuers that have to consider different currencies, time zones and securities settlement across as many as 50 investable markets.
Thankfully, growing scale means greater efficiency, with the cheapest world ETFs now charging just a quarter of what legacy global equity strategies charged almost two decades ago.
Though neither the cheapest nor the oldest ETFs on the roster, the $69bn iShares Core MSCI World UCITS ETF (SWDA) and $22.2bn Vanguard FTSE All-World UCITS ETF (VWRP) have captured the imagination of European investors and look set to keep this pace as savings plan and model portfolio providers drive new retail assets in their direction.
Under the bonnet
Starting with the larger of the two products, SWDA marked the beginning of BlackRock’s low-cost ‘core’ range when it launched just a few months after the firm finalised its paradigm-setting acquisition of Barclays Global Investors (BGI) and its iShares franchise in 2009.
Tracking the MSCI World index, the ETF – like its predecessor and Europe’s first world ETF, the $6.3bn iShares MSCI World UCITS ETF (IWRD) – offers exposure to 1,517 large and mid-cap companies representing around 85% of the float-adjusted market cap of 23 developed markets.
VWRP, meanwhile, helped kick off Vanguard’s UCITS ETF platform as the firm entered European ETFs in 2012.
Tracking the broader FTSE All-World index, the ETF offers exposure to 3,686 large and mid-cap stocks representing 90-95% of the investable market cap of “nearly” 50 developed and emerging markets.

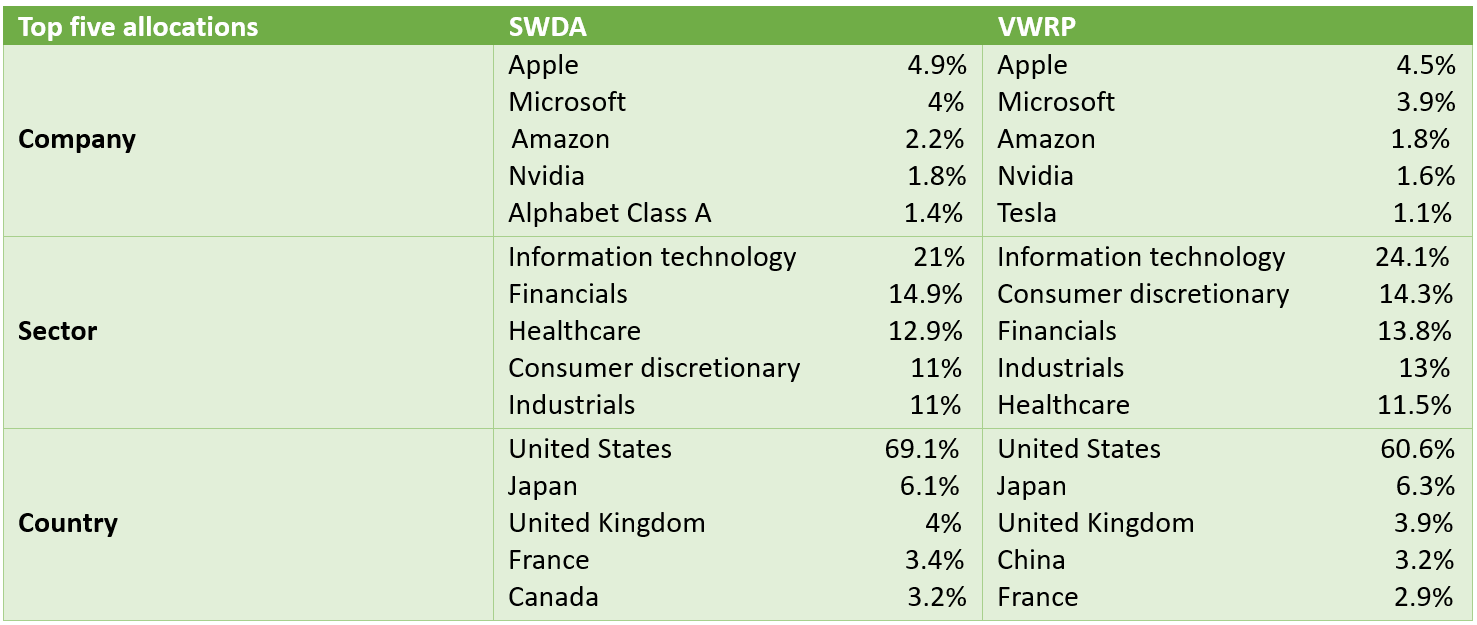
At first glance of the largest components of both products, there is an apparent overlap between usual suspect tech names, sectors and perhaps a surprising magnitude of dominance for US equities, comprising between 60-70% of both ETFs.
Investors will have to consider whether such an allocation to a single country aligns with their goal of having global exposure.
Vanguard’s strategy has a more modest weighting to US stocks than BlackRock’s, however, the key distinction only partially illustrated in its top allocations is the fact VWRP’s underlying index also allocates to emerging markets such as China, to provide a more substantively global exposure, whereas SWDA does not.
While SWDA is easily BlackRock’s most popular ETF offering world exposure, the more ‘apples with apples’ comparison with Vanguard’s product would be the sizeable but less prominent $8.2bn iShares MSCI ACWI UCITS ETF (SSAC), although this strategy’s 1718 constituents are still less than half the number captured by VWRP.
In numbers
Looking at how the two strategies have fared in practice, it is easy to see how SWDA has maintained pole position.
BlackRock’s candidate has returned 16.7% and 25.6% over the past one and three years, respectively, as at 2 February 2024, versus 14.2% and 18.4% for VWRP, respectively.
The story is similar when looking at total cost of ownership. With a relatively steep total expense ratio (TER) of 0.20%, SWDA's fees are double those of Europe’s cheapest world ETFs, however, it regains some ground for boasting securities lending returns of 0.02% and the tightest bid-ask spread in its peer group of just 0.03%, according to Bloomberg Intelligence data.
VWRP has a higher TER of 0.22% – which Bloomberg Intelligence noted is the weighted average for equity ETFs in Europe, including thematic and active strategies. Its bid-ask spread is also moderately wider at 0.04% and while the ETF also lends out its underlying, it does not disclose the return yielded from these activities.
Given cost and performance are two of the main considerations for investors, it may come as little surprise SWDA remains the dominant strategy in terms of asset gathering and in fact topped flows into European ETFs in 2021, 2022 and 2023.
SWDA is not without its flaws, though. For instance, other ETFs tracking the same index have far lower total cost of ownership.
The $11.7bn Xtrackers MSCI World UCITS ETF 1D (XDWL) has a TER of just 0.12%, a bid-ask spread of 0.04% and considerable securities lending revenue of 0.06%.
Also, in January, UBS Asset Management halved the TER on the UBS ETF MSCI Europe UCITS ETF (UB12) to 0.10%, making it Europe's lowest-fee MSCI World ETF.
Also, SWDA's US exposure may have flattered in performance terms over the last decade but MSCI World ETFs’ emerging market underweight may could see them come unstuck during changes in the market backdrop.
Finally, VWRP does a better job than SWDA of tracking its underlying index. There are just 24 basis points (bps) of tracking error between VWRP’s net asset value (NAV) – net of fees and reinvested dividends – and its benchmark since inception, versus 2.53% for SWDA.
Final word on world ETFs
Both ETFs represent relatively efficient and low-cost tools for capturing thousands of securities across different jurisdictions within a single trade.
Both products are Irish domiciled, meaning they are covered by Ireland’s Double Taxation Treaty with the US that halves the amount of withholding tax charged on dividend distributions to foreign investors by US firms from 30% to 15%.
Both are also awarded a Morningstar silver medal rating, reflecting the firm’s view on how the strategies will perform versus their peers over the next five years.
Vanguard’s ETF uses full replication and a wider net exposure to offer a world exposure that does what it says on the tin. BlackRock’s candidate has edged a lead on performance with its narrower basket and nimbler optimised sampling approach. Investors will have to decide which better suits their portfolio construction needs.


