The energy sector did badly last year with the S&P 500 Energy Sector Index falling 21.9% in 2018, but this year things are starting to pick up. The index is up 14.29% so far this year and combined with a sector that looks fairly cheap, energy stocks have historically been more resilient than the broader market during periods of rising interest rates and/or inflation, so now could be a good time to get in.
Energy ETFs are a good way to tap into the sector. There are a range to choose from on the London Stock Exchange with varying performance, but most have positive returns so far this year.
There are several issues to consider when choosing an energy ETF. Do you want global energy exposure, or just to energy companies in Europe or the US? Do you want your ETF hedged or leveraged? And how much does currency matter? These are some questions to ask before piling in and can make the difference between returns going up a lot, a little or down.
For example. Amundi's ANRJ and SPDR's ENGY did better in 2018 than they have done year to date - which is unlike most of the other energy ETFs. For example, ANRJ returned 5.70% year-to-date (YTD) compared to 10.32% over the past year. The reason for this is that both of these ETFs track European energy companies.
The volatility at the end of last year hit the US markets hardest. So European stocks, while impacted, weren't as volatile.
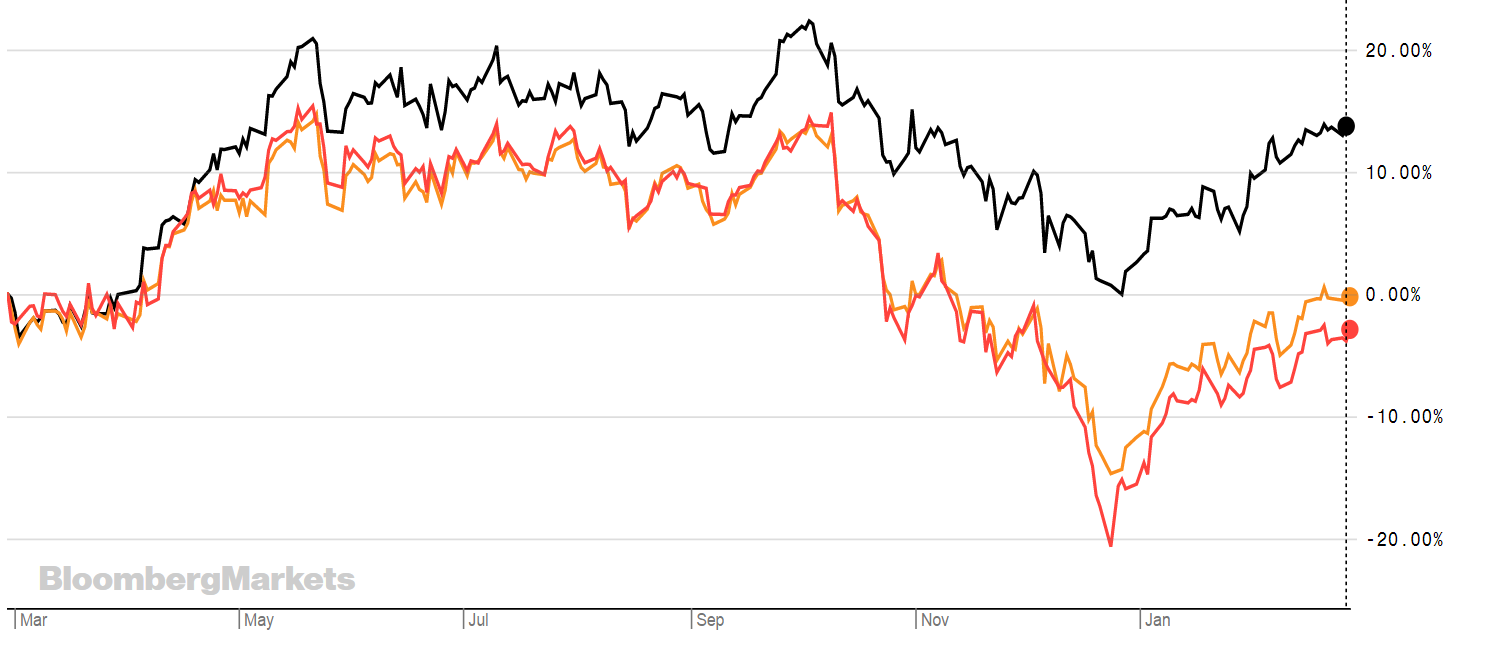
The graph below shows ENGY (black) compared to WNRG (orange), SPDR's all world ETF. As can be seen, WNRG, which has exposure to US energy companies, fell harder during the volatility in the last few months of last year. The red line is the S&P 500 energy sector index.

Source: Bloomberg
There are other reasons to back energy ETFs this year.
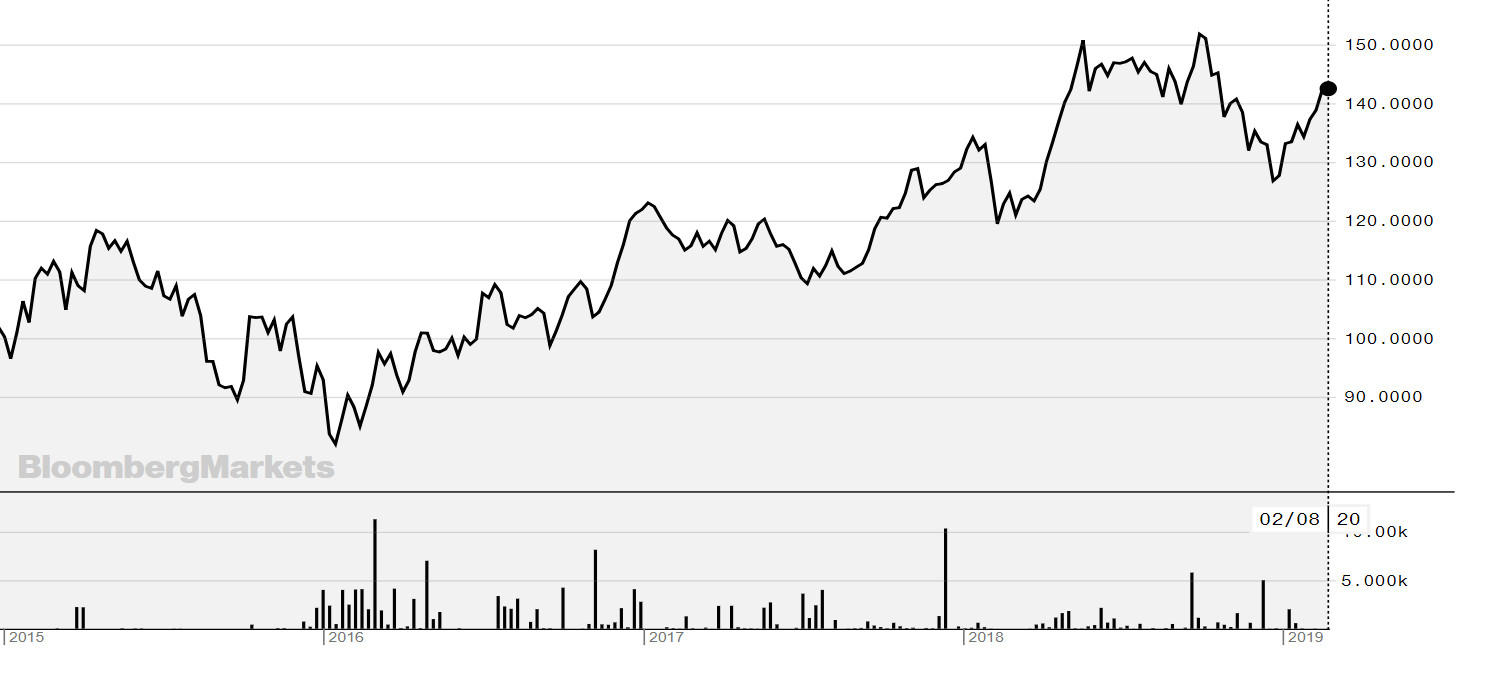
They can weather interest rate rises quite well. Below is ENGY over the last five years - at the end of 2017 the Bank of England lifted the official bank rate from 0.25% to 0.5%, the first time since July 2007. The ETF had positive returns in the last quarter of the year.

Source: Bloomberg
Russ Koesterich, portfolio manager at BlackRock Global Allocation fund, was reported as saying by Bloomberg that "Historically, energy stocks have been more resilient than the broader market during periods of rising interest rates and/or inflation. If part of what has dislocated the market is the challenge of navigating higher interest rates, energy companies offer a reasonable hedge. Finally, large integrated energy companies are offering dividend yields north of 4 percent. In a yield-starved world, this looks attractive."
However, the best performing product so far this year is the UBS ETC CMCI Energy USD (ENRU), which has returned 15.54% and has a TER of only 0.35% - over one year the return is only 3.41%. As shown below.
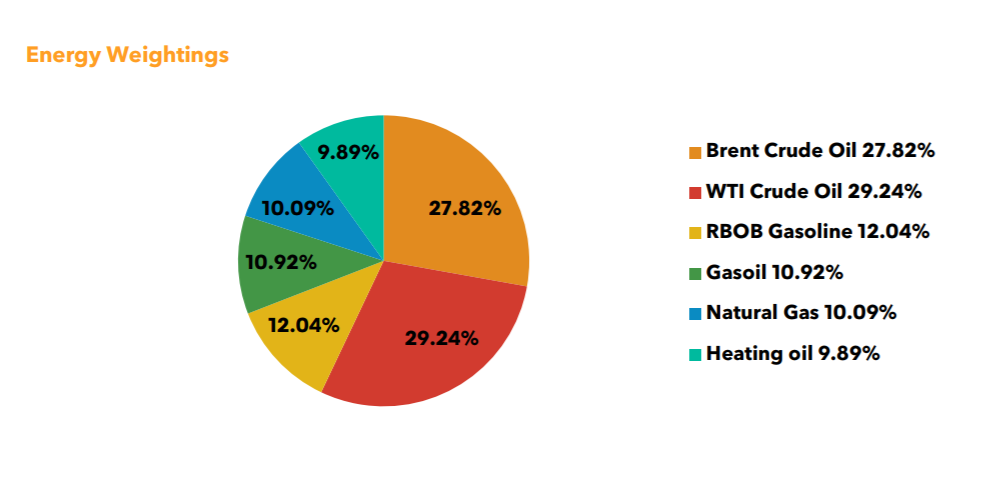
This - unlike ENGY, WNRG and ANRJ which track energy companies - is an exchange traded commodity because it tracks commodity future contracts. In this case it tracks 29 components with five maturities, across commodities, futures tenors and roll dates, according to UBS Bloomberg. It also enhances roll performance in contango and backwardation. It also has a large exposure to oil.
To show how big movements in the oil price can impact returns of the ETC, the chart below - from the UBS Bloomberg CMCI Energy Index fact sheet - shows the weightings in the index.

Source: Bloomberg
So why have energy ETFs done well this year?
It is likely that the reason for the uptick in energy ETFs this year is due to the rise in oil prices from 54.06 at the beginning of the year to 64.02 at the time of writing. By way of example, ETFS Brent Crude ETC has returned 21.97% YTD. And the good news is that the oil price rise is likely to continue for now.
CNBC reported that Goldman Sachs believes oil prices are about to go on a wild ride in 2019. "Brent crude oil could easily rise into the $70-$75 per barrel trading range in the coming months [it is currently trading at around $66. The fundamental supply-and-demand outlook is being bolstered by technical support after oil prices hit three-month highs."
However, Goldman Sachs warns of the "New Oil Order", which will push prices down. It explains on its website that the new oil order created by the US shale revolution is reshaping global energy markets and bringing with it a new era of volatility.
There are a number of energy ETFs available on the London Stock Exchange with varying degrees of exposure to oil depending on the index. A non-exhaustive list of these ETFs are noted below with YTD returns shown.
NAME
TER
YTD
RTN
INDEX
ETF/ETC
ETFS Longer Dated Energy (ENEF)0.49%12.76%Bloomberg Energy Subindex 3 Month Forward Total ReturnETCETFS Energy ETF (AIGE)0.49%10.45%Bloomberg Energy Total Return Index (previously DJ-UBSETCUBS ETC CMCI Energy USD (ENRU)0.38%15.54%UBS Bloomberg CMCI Energy USD Total ReturnETCUBS ETC CMCI Energy GBP (ENGB)0.50%14.78%UBS Bloomberg CMCI Energy GBP Monthly Hedged Total Return IndexETCETFS GBP DAILY HEDGED ENERGY (PENR)0.49%9.99%Bloomberg Energy Subindex Pound Sterling Hedged Daily Total ReturnETCETFS GBP Daily Hedged Longer Dated Energy (PFEN)0.49%12.66%Bloomberg Energy Subindex 3 Month Forward Pound Sterling Hedged Daily TRETC


