Income ETFs have exploded onto the investment scene in the last decade and investors have been keen to incorporate them into their portfolios in the face of slow growth and low-price returns. However, last year, returns were poor. So will these products come back into vogue or are they better left alone?
At the end of last year, the European ETF/ETP industry had 55 dividend focused products with assets of around $14bn, according to ETFGI.
They come in various forms; quality income, income, enhanced income, dividend income and various others. They vary in risk, reward and have different outcomes depending on the strategy they employ.
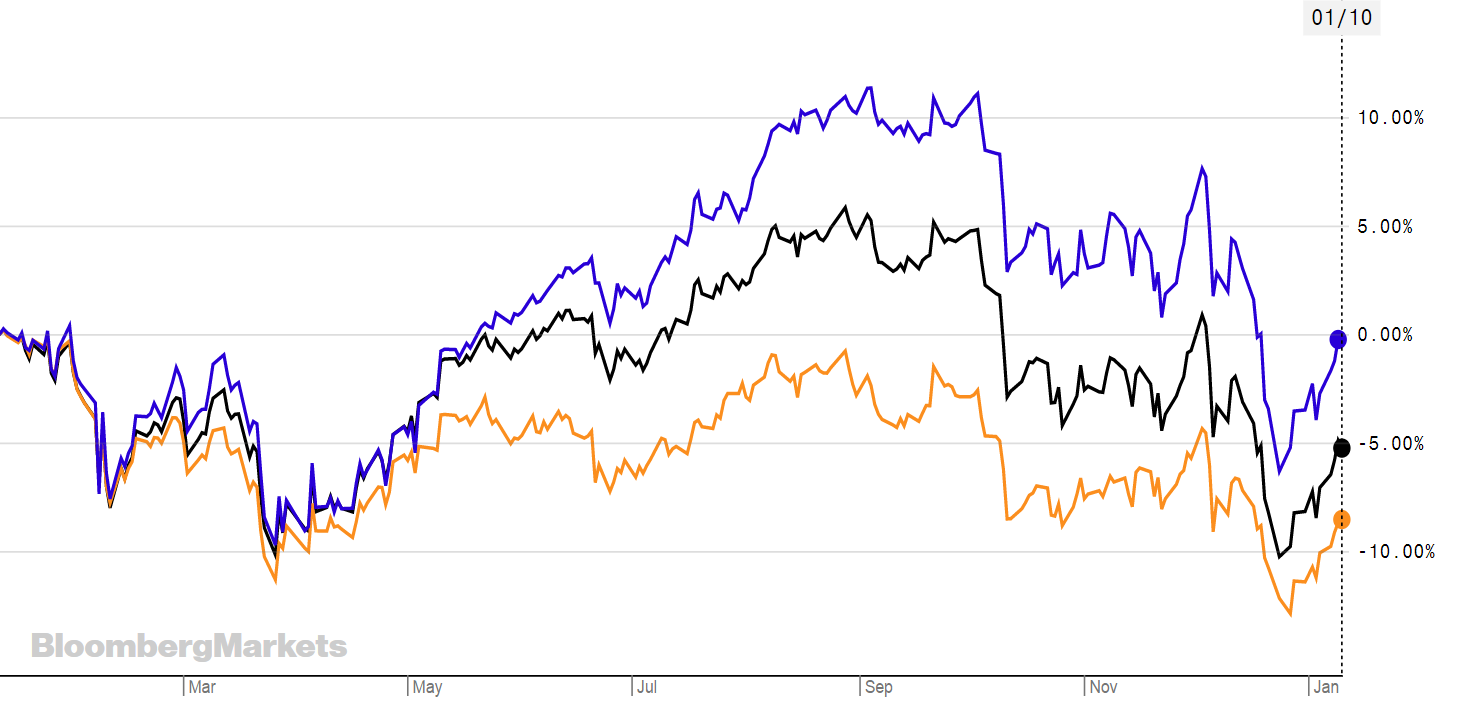
Here's a graph showing how some income ETFs did last year. The Vanguard S&P 500 ETF (VUSA) is in blue, the Vanguard FTSE World High Dividend Yield ETF is in orange, and the Vanguard FTSE Developed World UCITS ETF (VEVE) is in black.

There are murmurs of a recession this year, but as Seeking Alpha reports, it's more likely to be a slowdown and a return to the markets of a pre-2018 state.
In that case, income ETFs might help in limiting the drawdown effects of a falling or slowing market, with the added benefits of regular pay outs to investors. These payments are typically made through dividends whereby the company distributes a portion of its profits to shareholders every quarter, the rest are reinvested into the company.
But buyers beware. It's worth looking at the strategy underpinning ETF, as it will tell you how the income or dividends are dealt with - and how big the risk is.
For example, Lyxor's SG Global Quality Income NTR UCITS ETF (SGQD) was down -7.47% over the last year (at the time of writing) and costs 0.45%. It compares to Vanguard's FTSE All-World High Dividend Yield UCITS ETF (VHYL) which is down -5.63% over the same time period and costs 0.29%. Both are in US dollars, so there isn't a currency discrepancy.
Their make-up is very different.
SGQD has exposure to equities globally which are selected to provide a balance between high quality companies with a focus on above average dividend yields, and attractive and sustainable dividends. It has a three-star rating from Morningstar, who add that "the index methodology defines an investment universe of non-financial companies having a free float adjusted market capitalisation of at least US$3bn from developed countries."
Vanguard's VHYL tracks the FTSE All-World High Dividend Yield Index, which is a large and mid-cap market-cap weighted index of developed and emerging market common stocks with higher than average forecast dividend yield. It also had a three-star rating from Morningstar and is bronze rated.
There is no obvious way of telling which product is best when it comes to income, but what is clear is that you need to do your due diligence if you want to include it in your portfolio.
Nearly all the ETFs we looked at on the London Stock Exchange had negative returns for the last year. This was often better or worse depending on which currency the ETF was traded in. However, the best performing in general over the last year - with the least drawdown or even positive returns - were the US focused products.

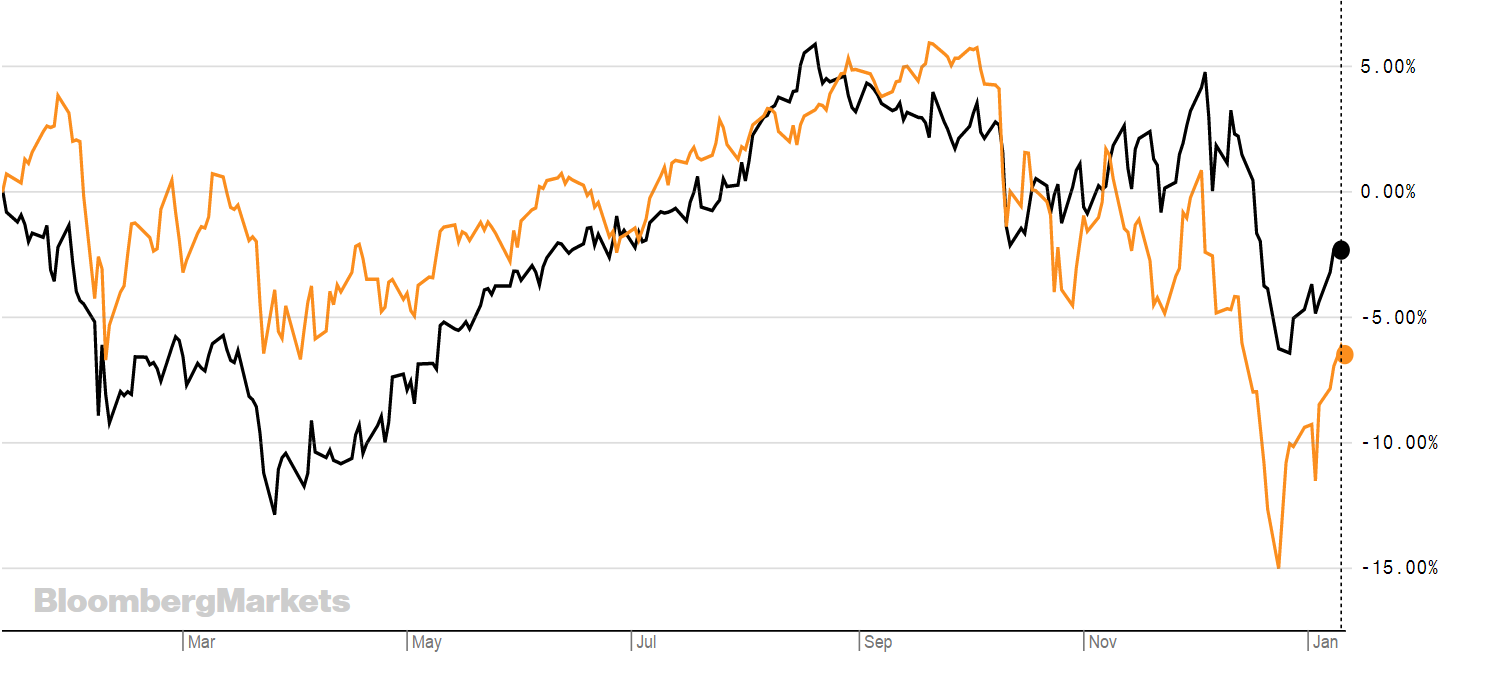
WisdomTree's US Equity Income UCITS ETF (DHS) is the only one with a positive return (helped by sterling). Above is a chart showing its performance (in black) against the S&P 500 index (in orange). The ETF tracks the price and yield performance, before fees and expenses, of the WisdomTree US Equity Income Index, which focuses on US large cap value equity stocks.
Below is a list of ETFs that offer some form of income.
ZWUU
ZIUS
FEMQ
FEQD
FUSA
FGQD
DHS
DEMD
EEIE
SGQG
SGQD
UINC
XUKX
Expense Ratio: 0.09%
XDDX
Expense Ratio: 0.09%
IUKD
QDIV
IDVY
EQDV
VHYL
EUDI
UDVD
USDV
UKDV
EUDV
ETF1YR RTNTERINDEXBMO Enhanced Income USA Equity UCITS ETF-4.60%0.30%Exposure to large-capitalisation US stocks, additional income happens through an actively-managed call option writing strategyBMO MSCI USA Income Leaders UCITS ETF-2.61%0.25%exposure to high quality large and mid-capitalisation stocks issued in the USA which have a history of paying above average dividends.Fidelity Emerging Markets Quality Income UCITS ETF-9.53%0.50%Fidelity Emerging Markets Quality Income IndexFidelity Europe Quality Income UCITS ETF-5.54%0.30%Fidelity Europe Quality Income IndexFidelity US Quality Income UCITS ETF-3.85%0.30%Fidelity US Quality Income Index.Fidelity Global Quality Income UCITS ETF-1.14%0.4%Fidelity Global Quality Income IndexWisdomTree US Equity Income UCITS ETF0.23%0.29%WisdomTree US Equity Income IndexWisdomTree Emerging Markets Equity Income UCITS ETF-7.49%0.46%WisdomTree Emerging Markets Equity Income IndexWisdomTree Europe Equity Income UCITS ETF-7.51%0.29%WisdomTree Europe Equity Income IndexLyxor SG European Quality Income NTR UCITS ETF-2.15%0.45%SG European Quality Income Index - representative of high quality stocks from a European investment universe that are likely to distribute high level dividends.Lyxor SG Global Quality Income NTR UCITS ETF-7.47%0.45%Exposure to the performance of equities from around the world, selected to provide a balance between high quality companies with a focus on above average dividend yields, attractive and sustainable dividends.First Trust US Equity Income UCITS ETF0.02%0.55%NASDAQ US Equity Income IndexXtrackers FTSE 100 Income UCITS ETF-6.48%M'ment fee: 0.01%FTSE 100 Total Return IndexXtrackers DAX Income UCITS ETF-16.98%M'ment fee: 0.01%DAX® IndexiShares UK Dividend UCITS ETF-11.21%0.40%FTSE UK Dividend + IndexiShares MSCI USA Quality Dividend UCITS ETF-3.24%0.35%MSCI USA High Dividend Yield IndexiShares Euro Dividend UCITS ETF-9.42%0.40%Dow Jones EURO STOXX® Select Dividend 30 Index.iShares MSCI Europe Quality Dividend UCITS ETF-5.67%0.28%MSCI Europe High Dividend Yield 4% Issuer Capped IndexVanguard FTSE All-World High Dividend Yield UCITS ETF-5.63%0.29%FTSE All-World High Dividend Yield Index, a large and mid-cap market-cap weighted index of developed and emerging market common stocks with higher than average forecasted dividend yieldSPDR S&P Euro Dividend Aristocrats UCITS ETF-7.04%0.30%The ETF tracks the performance of the 40 highest yielding Eurozone stocks from the S&P Europe BMI Index that have followed a managed dividend policy of increasing or stable dividends for 10 consecutive yearsSPDR S&P US Dividend Aristocrats UCITS ETF-1.28%0.35%The Fund tracks the performance of the stocks from the S&P Composite 1500 Index that have paid an increased dividend every year for 20 consecutive years.SPDR S&P US Dividend Aristocrats UCITS ETF4.56%0.35%The Fund tracks the performance of the stocks from the S&P Composite 1500 Index that have paid an increased dividend every year for 20 consecutive years.SPDR S&P UK Dividend Aristocrats UCITS ETF-11.73%0.30%The ETF tracks the performance of the 30 highest yielding UK stocks from the S&P Europe BMI Index that have followed a managed dividend policy of increasing or stable dividends for 10 consecutive yearsSPDR S&P Euro Dividend Aristocrats UCITS ETF-5.34%0.30%The Fund's objective is to track the performance of the 40 highest yielding Eurozone stocks from the S&P Europe BMI Index that have followed a managed dividend policy of increasing or stable dividends for 10 consecutive years.


