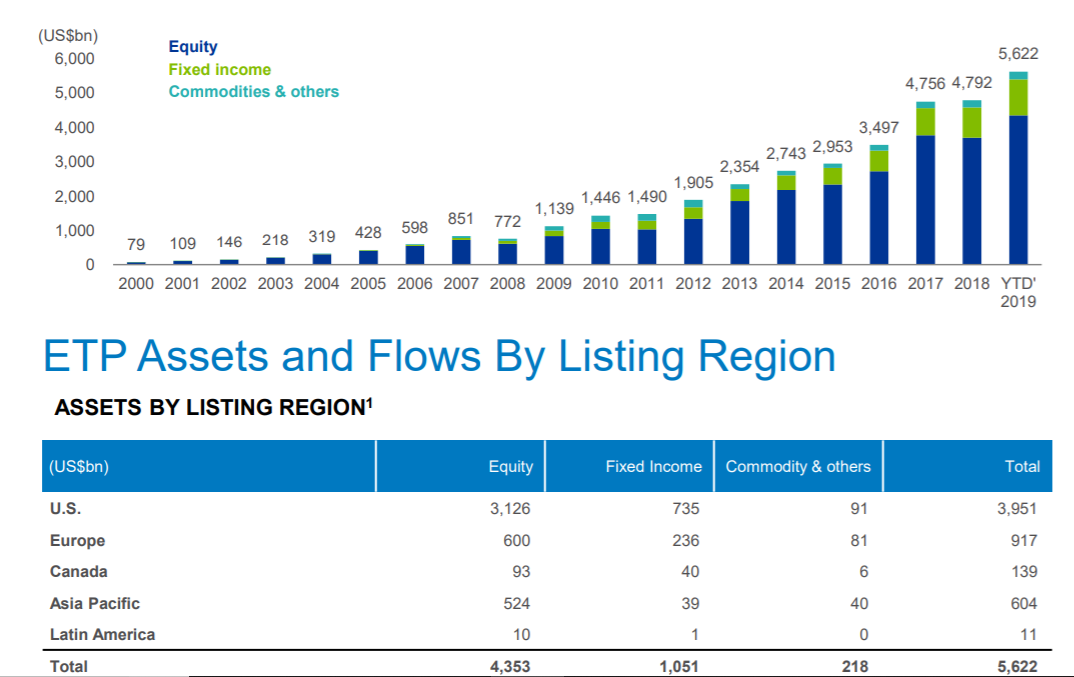
Data showing investor flows into ETFs was released last week and it showed that fixed income ETFs were the most popular in the second quarter of the year.
The data from BlackRock showed that $59.5bn flowed into fixed income ETFs globally, which was the strongest quarter on record. This is a turnaround on the first few months of this year when March saw fixed income outflows for the first time since November 2016.
According to BlackRock, the backdrop to investor flows includes weak economic momentum, political risks and relatively muted earnings growth.
The most popular areas of fixed income were US Treasury and investment grade bond ETFs and this suggests that investors are looking for somewhere safe to park their cash.

Source: BlackRock
Fixed income ETFs typically offer investors a level of protection and exposure is often increased in times of uncertain economic growth.
The FT wrote that: “Investors have turned to bond funds to reduce risk as doubts over the health of the global economy dominated markets in June. China and the US have failed to strike a trade deal, while central banks around the world have shifted toward more dovish monetary policies.”
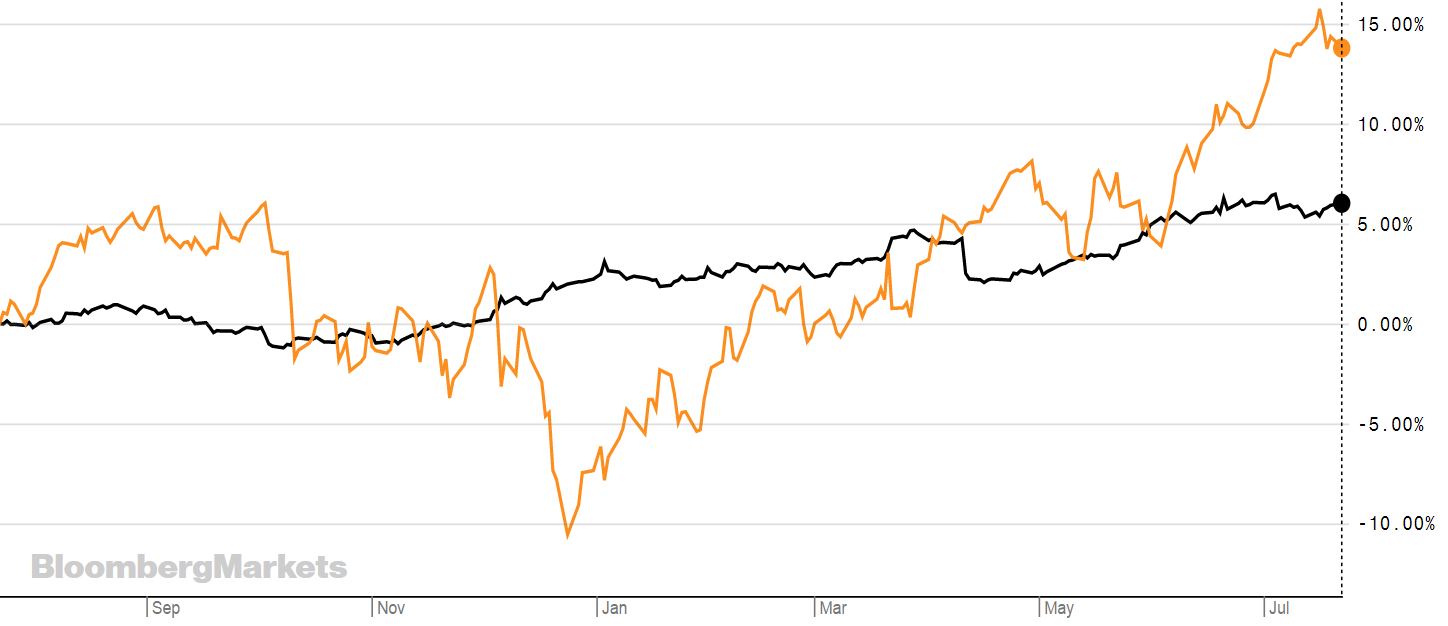
By way of example, the graph below shows Xtrackers US treasury ETF (XUTD) in black and its S&P 500 swap ETF (XSPX) in orange. The fixed income ETF remained fairly steady throughout the last year, even during the extreme volatility felt by equity markets at the end of last year.

However, there are different yields and risks associated with different fixed income ETFs. As we have written before, high yield bonds – also known as junk bond ETFs – are high paying bonds with a lower credit rating – and therefore higher risk – than other bonds such as gilts and treasuries. Because the risk of default is higher, they typically pay a higher yield. Issuers of these high-yield bonds tend to be start-up companies or capital-intensive firms with high debt ratios.
In the case of high-yield fallen angel ETFs, these include high-yield corporate bonds from issuers in developed markets that have – at some point in their trading history – been downgraded to a sub-investment grade.
One of the best performing fixed income ETFs is Xtrackers USD Corporate Bond UCITS ETF, which has returned over 12% year to date. The reason for this is the performance of the underlying index, which is the Bloomberg Barclays USD Liquid Investment Grade Corporate Index.
In fact, Investment Week recently published an article asking whether investment grade corporate bonds are a new safe haven.
It said: “Year-to-date, this asset class has recorded substantial performance worldwide. The background to this was mainly the monetary policy turnaround of the US Federal Reserve (Fed), which in January abandoned its previous plans of increasing rates.
In addition, growth and inflation expectations continue to be so low in Europe that the European Central Bank (ECB) is more likely to reconsider monetary easing measures than interest rate hikes.”
The low interest rate environment is also going to help fixed income, especially off the back of the volatility seen in equity markets at the end of next year. And with equity markets at record highs market watchers are now discussing when the market will turn.
Above all though, the uptake of fixed income is made all the more possible by fixed income ETFs, which have given access to an asset class that was typically opaque and relatively tricky to access.
MJ Lytle, CEO at ETF provider Tabula, says: “There are some meaningful drivers in the fixed income space, such as Italian government bonds (i.e. yield in Europe), emerging market bonds, high grade government bonds and Investment Grade corporate debt.
“The reasons for investors moving their money here are two-fold, those in Italian government bonds and emerging market bonds are likely taking risk to increase yield, while those in high grade government - and investment grade corporate – debt are most likely parking their cash in safe assets… But the bigger story is that investors are increasingly using fixed income ETFs as a way to implement their fixed income exposure.”
Below we list a variety of different the types of fixed income ETFs and their performance so far this year.
RTN
XUTD
Expense Ratio: 0.07%
TSY3
TRE7
US10
VDTA
IHYA
SEUC
PUIG
TCGB
XBLC
Expense Ratio: 0.16%
VECP
ETFYTD TERINDEXXtrackers II US Treasuries UCITS ETF5.31%M’ment Fee: 0.01%iBoxx® $ Treasuries Total Return IndexSPDR Bloomberg Barclays 1-3 Year U.S. Treasury Bond UCITS ETF4.76%0.15%Bloomberg Barclays US Treasury 1-3 Year IndexInvesco US Treasury 3-7 Year UCITS ETFn/a0.06%Bloomberg Barclays US Treasury 3-7 Year IndexLyxor iBoxx $ Treasuries 10Y+ DR UCITS ETF10.57%0.07%iBoxx $ Treasuries 10Y+ IndexVanguard USD Treasury Bond UCITS ETFn/a0.12%Bloomberg Barclays Global Aggregate US Treasury Float Adjusted IndexiShares USD High Yield Corp Bond UCITS ETF8.83%0.5%Markit iBoxx USD Liquid High Yield Capped IndexSPDR Bloomberg Barclays 0-3 Year Euro Corporate Bond UCITS ETF0.89%0.2%Bloomberg Barclays 0-3 Year Euro Corporate Bond IndexInvesco USD Corporate Bond UCITS ETF10.53%0.16%Bloomberg Barclays USD IG Corporate Liquidity Screened Bond IndexThink iBoxx Corporate Bond UCITS ETFn/a0.15%Markit iBoxx EUR Liquid Corporates IndexXtrackers II EUR Corporate Bond UCITS ETF6.34%M’ment Fee: 0.06%Bloomberg Barclays Euro Aggregate Corporate Bond IndexVanguard EUR Corporate Bond UCITS ETF6.51%0.12%Bloomberg Barclays Euro-Aggregate:Corporates Index


