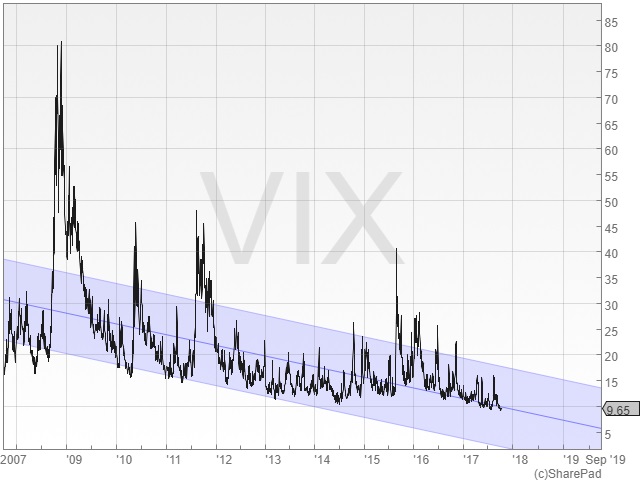
Low levels of market volatility have been worrying investors for most of 2017 - at varying points over the last ten months, market turbulence as measured by the VIX index (which tracks the variance of S&P 500 equities) has hit all time levels, with single digits for the index recorded on many days this year. The chart below, from www.sharepad.co.uk, shows end of day Vix levels for the last ten years - notice the steady decline with just a few peaks in volatility.

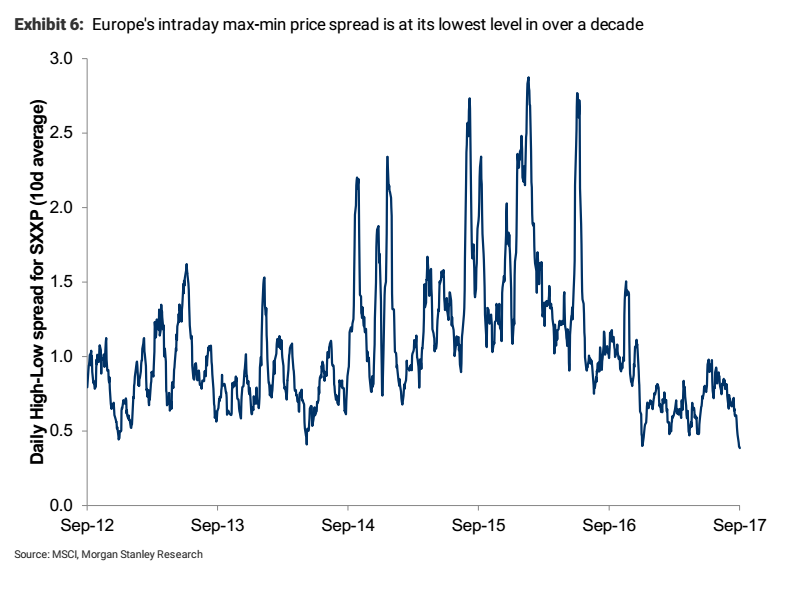
This week a report from Europe based equity analysts at American bank Morgan Stanley suggests that this isn't the only 'strange' market development based on technical measures. The analysis by Graham Secker and Matthew Garman observes that intra-day volatility is also extremely "depressed. Over the last 5Y the average (10-day) max-to-min intraday spread in the STOXX 600 has been 1.06%, however this same metric has been below 1 continually all year and is currently down to just 0.38%. This level is the lowest we've seen in over a decade."

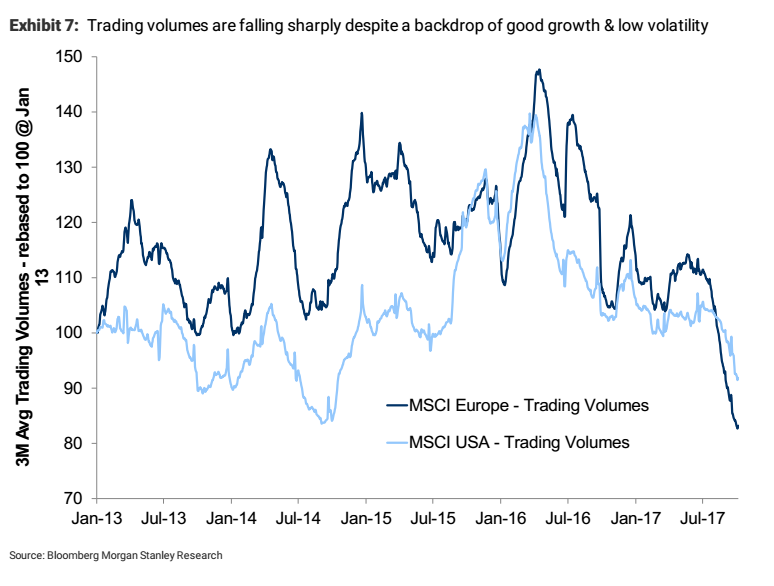
This sharp decline in intraday volatility has also been accompanied by a sharp fall in trading volumes both in Europe and the USA. According to the MS analysts "youmight think that a combination of strong and stable economic growth, coupled with very low volatility, would encourage investors to become more active in equity markets, however the opposite seems to be occurring. As we show below, Bloomberg data suggest that trading volumes for MSCI Europe and MSCI USA have fallen materially in recent months - this is most acute in Europe where volumes are at their lowest level in over 5 years."
In sum, both inter and intraday volatility is close to all-time lows, while trading levels have fallen sharply, yet equities continue to power higher, pushing valuations close to historic highs. Has central bank QE finally tamed volatile global markets?


