As stock markets in London and New York hit fresh record highs last week, the Vix index or 'fear gauge' hit new record lows.
Simply put, the Vix measures expected volatility in the S&P 500 in the near future, so it seems that investors aren't expecting dramatic moves in US share prices in the near future. What's more, given the sustained rise in the S&P, it seems that many investors don't think current valuations are too high either.
I'm not going to debate current valuations in this piece. Instead I'm going to give a bit more detail on what the Vix is and how it works.
So what exactly is the Vix?
The official name is the CBOE Volatility index - CBOE stands for Chicago Board Options Exchange.
As I said, it's a measure of expected volatility. If the market expects the S&P 500 to be unusually volatile over the next year then the Vix index should be high, and if the market expects low volatility, then the index should be low.
As a rough and ready guide, if the Vix is below 20, the market is forecasting a pretty healthy and calm stock market environment. If the Vix goes above 20, then the market is perhaps becoming more fearful. It's certainly expecting fairly high levels of share price movement, which could be up or down.
If the Vix falls to really low levels, say below 10, that may reflect too much complacency in the market, which may mean the market is heading for a fall. But that's not a universally accepted interpretation of a low Vix index. (This issue is discussed in more detail in the latest edition of the Big Call radio show here on ETFstream. And we'll also come back to it in another article in this series of articles on volatility.)
If you want a more precise description of what the Vix index measures, it represents the expected move in the S&P 500 up or down over the next year with a 68% confidence level. So if the Vix is at 15, the S&P is expected to move up or down by less than 15% over the next year, and there's 68% certainty on that.
There's some pretty complex maths behind the index, which I'm not going to go into, but the starting point is to look at options being traded on the S&P. If you're expecting high volatility for the S&P then an option on that index becomes more valuable because there's a higher chance that your option will end up in the money. (You can read how options work here.) So as expectations of higher volatility push up option prices, the vix index rises as well.
Recent movements
The Vix index soared at the time of the financial crisis to around 50. Very briefly, it went as high as 85. These were clearly panic-driven moves by the market. Then it fell quite quickly back to around 15 in 2010 before jumping back to around 50 in the midst of the eurozone crisis in 2012. Once again it fell back fairly quickly and then oscillated between about 12 and 27 over the next three years. The Brexit referendum and Trump's victory triggered brief jumps but the trend has been firmly down in 2017 falling to its current level around 9.
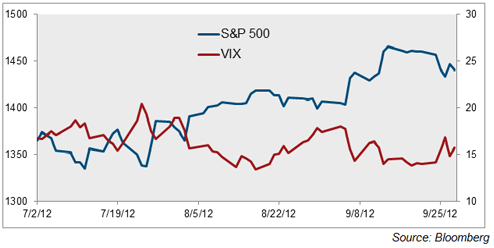
The interesting thing about past performance is that the Vix has a strong inverse relationship with the S&P. When the S&P moves down, the Vix will very likely move up. Look at this chart:

The CBOE says that the Vix moved in the opposite direction of the S&P about 80% of the time between 2000 and 2012.
Does it have any predictive power?
We've seen that the index measures current expectations of volatility. The obvious follow-on question is: do those expectations prove to be correct? Is it a useful forecaster?
This is a controversial topic with some academics suggesting that the predictive power is no better than just looking at current levels of volatility. One study from a company called Opinionmetrics suggested that no more than 1.2% of the VIX's daily movement indicates changes in market sentiment that are not already reflected in the S&P 500 index.
What is clear is that the Vix is at very low levels, as this series continues we'll look at whether this presents any money-making opportunities for investors.


