Deglobalisation is the trend of reducing global interconnectedness and integrating more closely with local and regional economic systems. The developed economies, especially the US and EU, have sought in recent years to diversify their trade partners, bringing their supply chains closer to home. Government policy is also formalising this course. As companies realign their supply chains, shedding old and finding new links, opportunities are being created.
In this article, we explore how investors can identify potential beneficiaries of global supply-chain realignment. Using MSCI Economic Exposure data, we illustrate our approach based on exposure to the US economy. The same analysis could be applied from the viewpoint of other regions and countries.
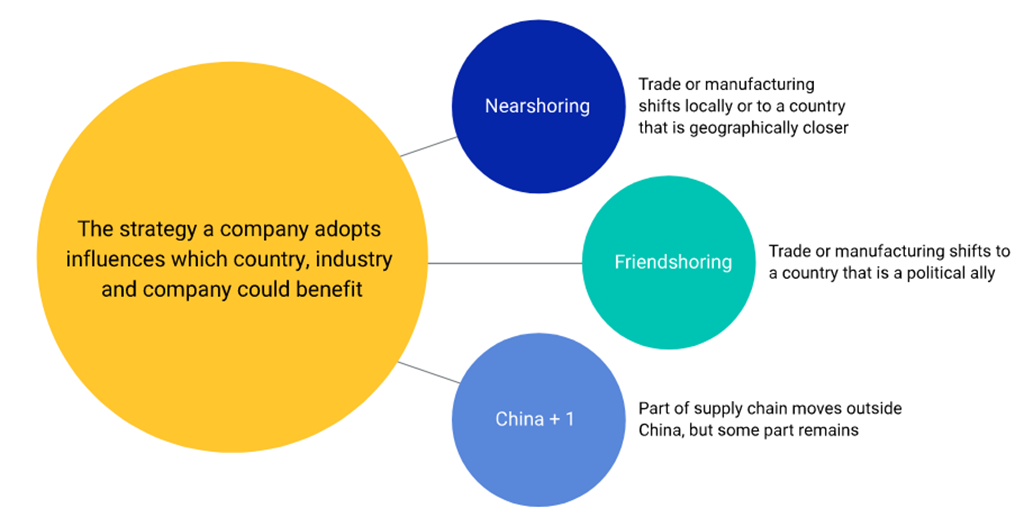
Chart 1: A company’s ‘shoring’ strategy influences likely beneficiaries

Industry-level opportunities
Certain industries are more susceptible to the effects of deglobalisation. Although some companies in these industries may experience negative repercussions, others are positioned to benefit.
One way to assess the impact on an industry is by evaluating governments’ public-policy tools. For example, under the umbrella of so-called Bidenomics,¹ supply-chain resilience is being prioritised over immediate cost-cutting concerns.² Similar efforts are underway in the EU, with the bloc’s adoption of the European Economic Security Strategy³ and legislation such as the European Chips Act.⁴ Corporate management could interpret these directives as encouragement to move their companies’ supply chains closer, or back, to their home countries or regions.
Another approach is to analyse an industry’s economic exposures. We use MSCI Economic Exposure data to aggregate the economic exposures of Global Industry Classification Standard (GICS)⁵ sectors. We can illustrate this process using the US and China, which has historically been the US’s largest trading partner but has recently been surpassed by Mexico.⁶
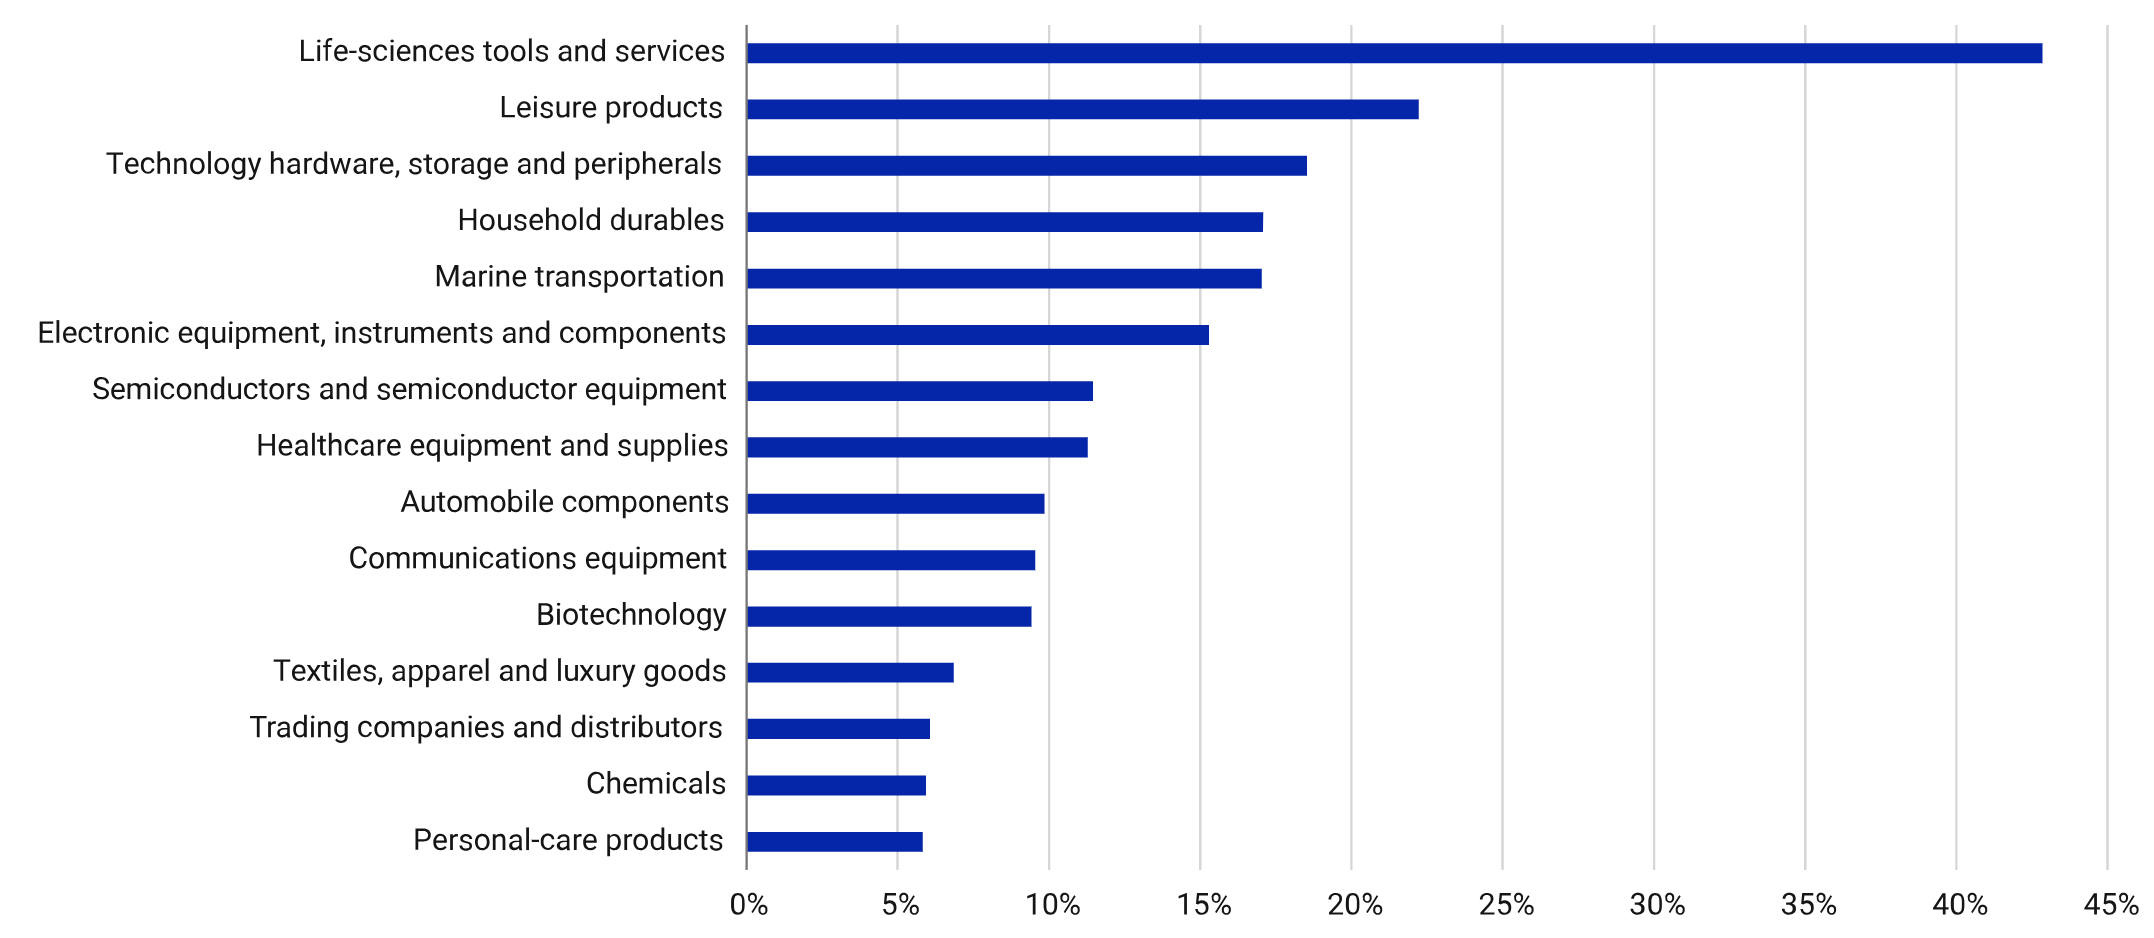
For this exercise, we identify the industries in the MSCI China All Shares Investable Market Index (IMI) with the highest exposure to the US economy.
Chart 2: Industries with highest US economic exposure in the MSCI China All Shares IMI

Source MSCI, Data as of 31 March 2023. The methodology calculates the weighted-average US economic exposure of each GICS industry in the MSCI China All Shares IMI.
Firms in these industries would likely be the most vulnerable to US-initiated supply-chain realignment efforts.⁷ Our analysis shows that the semiconductor, semiconductor-equipment, biotechnology and chemical industries could experience the greatest impact from US companies’ shifts to nearshoring, friendshoring and reshoring. Several of the industries overlap with those mentioned in President Biden’s executive order.
A simulated-index approach to identify probable beneficiaries
Using the preceding GICS-based industry-selection process, we constructed a simulated index of probable beneficiaries of supply-chain relocation to the emerging markets (EM) ex China. We selected companies in industries with the highest US economic exposure. Our rationale is that if US companies diversify their supply chains away from these industries in China, the same industries in EM ex China could benefit.
We excluded some of the industries identified in our analysis because their name indicated a services orientation and, therefore, were less likely to be candidates for supply-chain realignment.
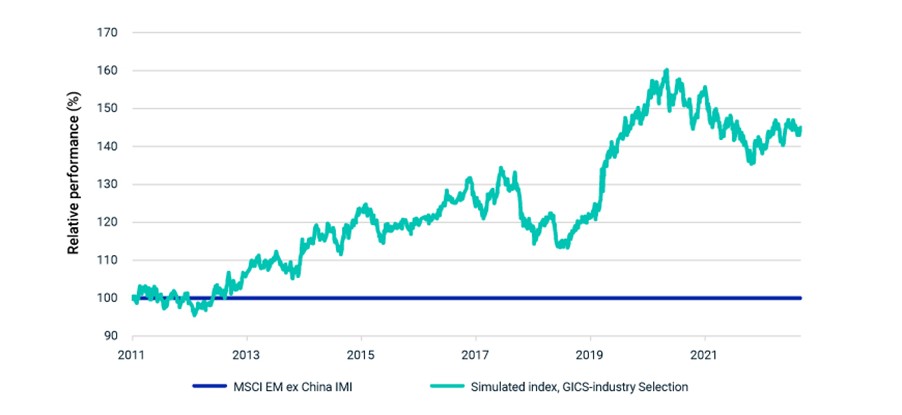
From June 2011 through August 2023, the simulated index outperformed the MSCI Emerging Markets Investable Market index by 45% on a cumulative basis.
Chart 3: The simulated index of likely shoring beneficiaries outperformed

Performance of the simulated index is relative to the MSCI Emerging Markets ex China Investable Market Index from Dec. 30, 2011, to Aug. 31, 2023, using net total returns in USD.
Our approach could be refined by applying one or more of the following filters, as we assume that supply-chain relocation would impact manufacturing-based companies more than service-based companies:
Business-revenue information to gauge a company’s revenues from manufacturing activities.
Analysis of a company’s real assets (plant and equipment) to determine if its location offers a logistical advantage in a supply-chain realignment, making it a strong candidate as a supply-chain partner.
Thematic or structural opportunity?
Developed economies’ interest in building stronger trade ties closer to home and with economic and political allies appears to be intensifying. As the move to rewire supply chains gains momentum, a practical analysis of how companies could be impacted by deglobalisation should uncover likely beneficiaries.
We have illustrated potential ways to evaluate the impact on industries and companies as well as an indexed approach that considers both thematic and structural opportunities.
Learn more at https://www.msci.com/our-solutions/indexes/thematic-investing
1. “What is Bidenomics?” Economist podcast, June 30, 2023.
2. President Biden issued an executive order mandating that his administration strengthen supply chains supporting the US economy. “Executive Order on America’s Supply Chains,” The White House, Feb. 24, 2021.
3. “An EU approach to enhance economic security,” European Commission, June 20, 2023.
4. “European Chips Act,” European Commission, accessed on Nov. 10, 2023.
5. GICS is the global industry classification standard jointly developed by MSCI and S&P Global Market Intelligence.
6. Luis Torres, “Mexico seeks to solidify rank as top US trade partner, push further past China,” Federal Reserve Bank of Dallas, July 11, 2023.
7. We base this statement on the assumption that Chinese firms with high US economic exposure are likely a link in a US company’s supply chain.
Disclaimer
The information contained herein (the “Information”) may not be reproduced or disseminated in whole or in part without prior written permission from MSCI. The Information may not be used to verify or correct other data, to create indexes, risk models, or analytics, or in connection with issuing, offering, sponsoring, managing or marketing any securities, portfolios, financial products or other investment vehicles. Historical data and analysis should not be taken as an indication or guarantee of any future performance, analysis, forecast or prediction. None of the Information or MSCI index or other product or service constitutes an offer to buy or sell, or a promotion or recommendation of, any security, financial instrument or product or trading strategy. Further, none of the Information or any MSCI index is intended to constitute investment advice or a recommendation to make (or refrain from making) any kind of investment decision and may not be relied on as such. The Information is provided “as is” and the user of the Information assumes the entire risk of any use it may make or permit to be made of the Information. NONE OF MSCI INC. OR ANY OF ITS SUBSIDIARIES OR ITS OR THEIR DIRECT OR INDIRECT SUPPLIERS OR ANY THIRD PARTY INVOLVED IN THE MAKING OR COMPILING OF THE INFORMATION (EACH, AN “MSCI PARTY”) MAKES ANY WARRANTIES OR REPRESENTATIONS AND, TO THE MAXIMUM EXTENT PERMITTED BY LAW, EACH MSCI PARTY HEREBY EXPRESSLY DISCLAIMS ALL IMPLIED WARRANTIES, INCLUDING WARRANTIES OF MERCHANTABILITY AND FITNESS FOR A PARTICULAR PURPOSE. WITHOUT LIMITING ANY OF THE FOREGOING AND TO THE MAXIMUM EXTENT PERMITTED BY LAW, IN NO EVENT SHALL ANY OF THE MSCI PARTIES HAVE ANY LIABILITY REGARDING ANY OF THE INFORMATION FOR ANY DIRECT, INDIRECT, SPECIAL, PUNITIVE, CONSEQUENTIAL (INCLUDING LOST PROFITS) OR ANY OTHER DAMAGES EVEN IF NOTIFIED OF THE POSSIBILITY OF SUCH DAMAGES. The foregoing shall not exclude or limit any liability that may not by applicable law be excluded or limited. Privacy notice: For information about how MSCI collects and uses personal data, please refer to our Privacy Notice at https://www.msci.com/privacy-pledge. The process for submitting a formal index complaint can be found on the index regulation page of MSCI’s website at: https://www.msci.com/index-regulation.


