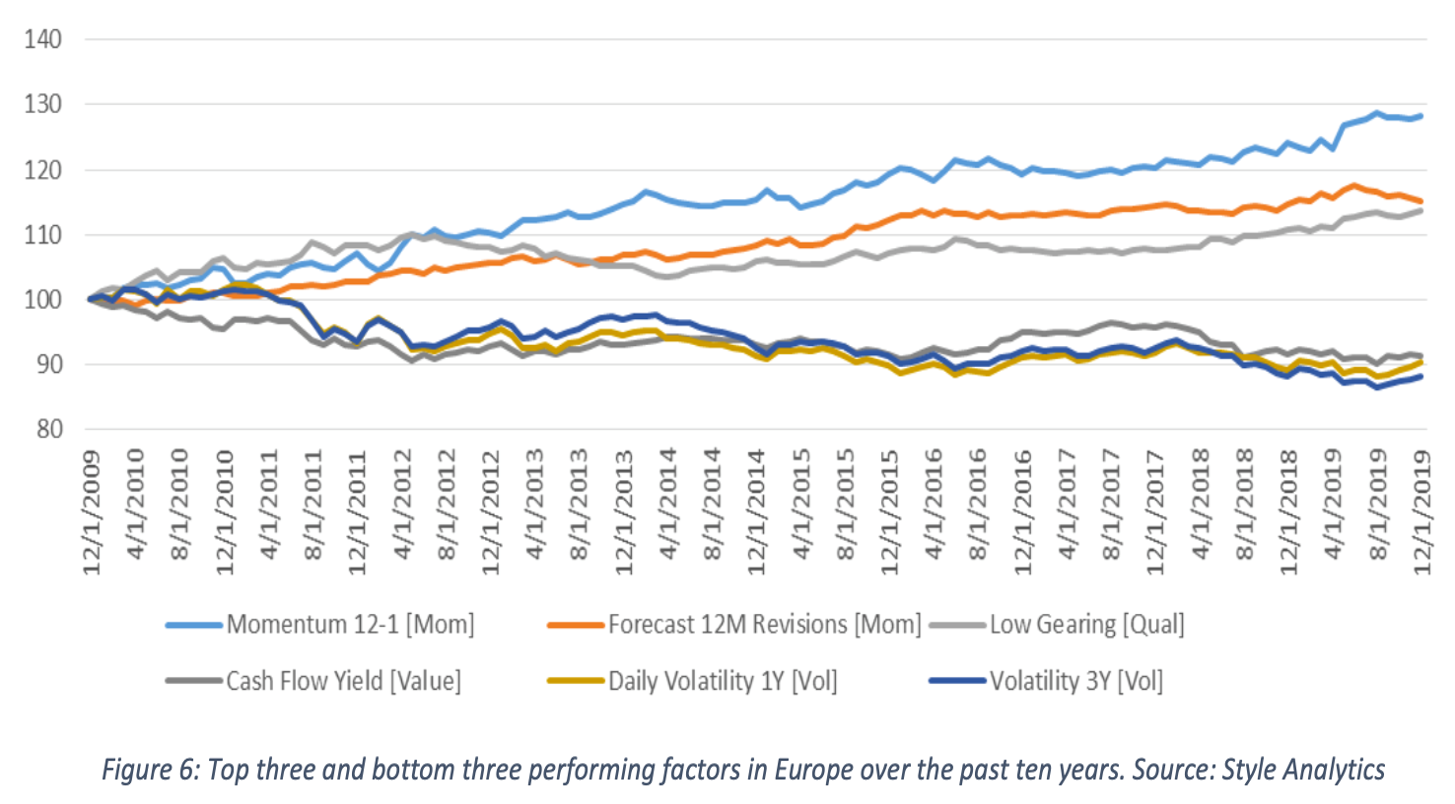
While the debate over backtests looks sure to continue into the next decade, the researchers at Style Analytics have provided a useful chart from the performance of key factors over the past 10 years that demonstrates the effectiveness of analysing equity performance by factor in Europe.
Isolating the top three and bottom three performing factors since 2010, the team show that two momentum factors (momentum 12-1 and forecast 12m revisions) and a quality factor (low gearing) showed steady and, crucially, consistent results over the 10 years while the value factor of cash flow yield and two volatility measures equally provided consistency in under-performing. (See table: Three best/worst European factors over the past 10 years)
Three best/worst European factors over the past 10 years

Source: Style Analytics
The Style Analytics team of Bernie Nelson (pictured), chief research adviser and Tom Idzal, managing director for North America, suggest it is “worth pointing out the steady and consistent trends of these factors and the magnitudes of the differences from the market, which are quite significant.”
“Individual factors can and do matter in European equity market,” the pair add.
A difficult 12 months for momentum
However, in the short term, over the course of the past 12 months the Style Analytics team point to a shift against momentum and a clearer move instead towards more quality factors.
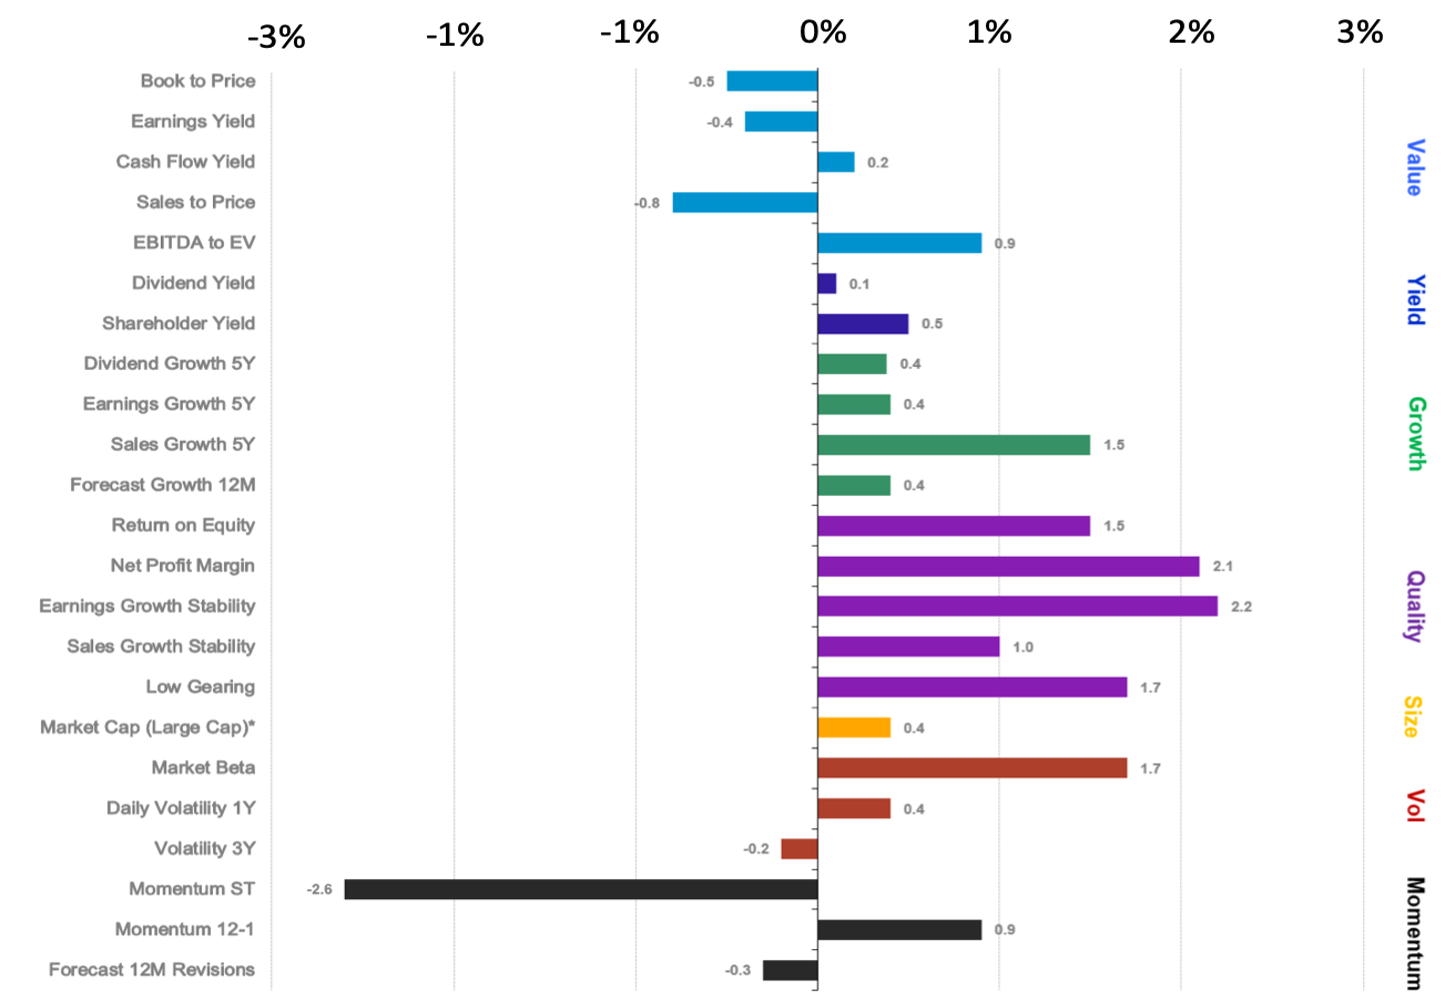
The analysis of the past year shows that net profit margin, earnings growth stability, sales growth stability and low gearing and return on equity all enjoyed a positive year while momentum (short term) was by some distance the worst performing factor for 2019.
European factor performance full year 2019

Source: Style Analytics
The Style Analytics team attribute the poor momentum (short term) performance to issues at an individual stock level.
“The negative return in short-term momentum reflects the frequent reversals in stock returns over the year and was not driven by any one country or sector but was more stock specific,” they suggest.
There was a continuing clear divergence between Europe and the US over the course of 2019. In the latter case, it was value factors that outperformed with shareholder value particularly strong driven by the continued corporate splurge of share buybacks. Quality, meanwhile, was much more mixed with high return on equity, high margins and stable earnings doing well but sales growth stability underperforming.
“This polarised behaviour demonstrates that quality is a complex style and can be defined by diverging metrics,” say Nelson and Idzal.
On an even shorter-term view, Style Analytics suggest that the fourth quarter saw a definitive move into value and especially high earnings yield.
“Last quarter’s analysis revealed that September 2019 was a turning point for value stocks in the US where investors piled into them in swift response to a steepening yield curve after months of experiencing a flattening and inverting yield curve,” they write.
Nelson and Idzal suggest the strength in value factors reflects optimism on earnings growth in 2020 along with hopes that the trade tensions from last year will continue to abate in 2020.
“Despite its slow start in the first eight months of the year, value caught up with growth in the final stretch and finished the year in solid positive territory,” they point out.
“Looking forward, a sustained value rebound will still require a steepening yield curve, economic recovery and some maintained positive corporate profit growth. The recent positive sentiment from the US-China trade rhetoric may have been a catalyst for continued strength in value.”
They predict continued interest in defensive themes such as high quality, low volatility and high dividend yield.
A review of the fourth quarter in emerging markets adds a further interesting angle to the discussion as the Style Analytics team note how the outperformance of three quality factors was counterbalanced by underperformance of two others.
Style Analytics: Getting defensive with factors
While return on equity, net profit margin and sales growth stability were each ahead in the last three months of the year, both Earnings growth stability and low gearing were the worst performing factors for the period. As Nelson and Idzal say, it reminds them that “quality is a complex investment style with potentially self- inconsistent underlying factors.”
Clear EM picture
Over the course of the year, the analysis shows there was a “very clear style picture in emerging markets” of large cap growth and quality at the expense of value and yield.
This was against a backdrop of an 11% gain for the emerging market index, a performance which many analysts believe will accelerate into 2020.
The Style Analytics team add, however, there still appears to be some appetite for quality factors in terms of profitability while investors are also looking at demonstrated earnings and revenue growth among the large-cap name.
“This may be indicative of other pessimistic crosswinds in emerging markets such as continued fears that US-China trade issues are still going to have a long-term global impact beyond China’s own slowing growth,” they write. “Alternatively, it could be a systematic requirement of investors in emerging markets to demand some growth or quality reassurance in this clearly volatile region.”
Evidence for the latter being the case comes from a look at the best-performing factors in the last 10 years where is can be seen that return on equity has always been one of the top five factors in all but one year (2016).
“This not only confirms the importance of quality to investors in emerging markets but reveals that return-on-equity appears to be the preferred quality factor of emerging markets investors,” say Nelson and Idzal.


