Last year marked the return to volatility. As central banks started withdrawing liquidity from the market, equities took a tumble. Bernie Nelson, President, North America, at Style Analytics, studies how investors should play more volatile markets and what factors work best in certain conditions.
Since the beginning of the fourth quarter 2018, equity investors have had a roller coaster ride, with equity markets only recently recovering from a very weak fourth quarter in 2018. This volatility, combined with the brief inverted yield curve in March in the US, has increased investor concern of a global economic slowdown or recession following an extremely long bull market. Many investors will be questioning whether to adopt a more defensive position in their equity funds.
Traditionally, equity investors take defensive positions by investing in non-cyclical sectors such as consumer staples, utilities or health care. Nowadays investors are being offered an array of funds promoting factor investing that proclaim “defensive” strategies such as Low Volatility or Quality. Low Volatility funds are often sold as single, factor-focused funds, whereas Quality tends to be positioned alongside Value or High Dividend, or integrated within a multifactor approach. There is now a dizzying array of funds for investors to consider, verify and compare. How can investors make sense of this?
LOW VOLATILITY
Different measures can be used to estimate low volatility, including market-relative beta, or absolute volatility using daily or monthly stock returns typically over the past 1, 3, or 5 years. Often, a few measures will be combined to form factor portfolios, which is why it is important to understand the definitions used since they can lead to different stock choices. Much has been written on the low volatility anomaly across global equity markets, specifically the outperformance of low volatility stocks as compared to high volatility stocks on a risk-adjusted basis.
One hypothesis for this anomaly is an irrational investor bias towards high-risk, “lottery”-like payoffs from highly volatile stocks. Other reasons put forward include the fact that fund managers judged against index benchmarks have an incentive to own higher-beta stocks, as well as investor restrictions on short selling or leverage potentially leading to higher demand for high-risk stocks and overpricing.
Regardless of these reasons, we know that low volatility strategies have become popular since the global financial crisis. This may simply be a case of investors wanting to reduce portfolio risk and ensure downside protection by giving up some upside participation. The low volatility anomaly may encourage investors to maintain this strategy on a longer-term basis.
QUALITY
Quality is a more wide-ranging factor than low volatility and is based on company fundamentals rather than historic returns. But what makes a company ‘quality’ to one investor can be quite different from another. Profitability is usually the cornerstone of most definitions, often measured by high return on equity or high-profit margin. But some investors also look at indicators such as stability of revenues or earnings, or low financial leverage based on, for example, debt to equity.
Quality is considered a factor because higher quality companies have tended to outperform lower-quality companies. One might think that these known attributes would already be reflected in share prices. Some explanations for the quality premium focus on behavioural investor biases, include excessive optimism for headline earnings regardless of their sustainability, or expectations that high-quality and low-quality firms will mean revert faster than they actually do.
COMPARING LOW VOLATILITY AND HIGH QUALITY
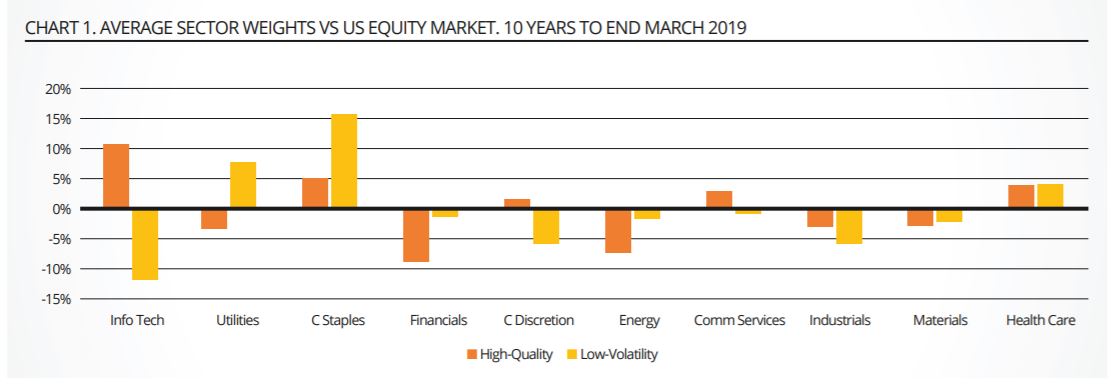
We can construct both Low Volatility and High Quality factor strategies based on cap-weighted, top-quartile screens using similar factor definitions as described earlier. Chart 1 shows the average active sector weights for each strategy over the past 10 years for US equities. While consumer staples and health care are overweight in both strategies, consumer staples is more dominant in Low Volatility. High Quality has been very overweight in Info Tech but Low Volatility has been very underweight, a difference of more than 20%. Utilities is overweight in Low Volatility but underweight in High Quality.

By continuing to compare and contrast these two strategies, we run the risk of merely explaining the difference in performance and characteristics between sectors. To avoid that distortion, and to focus more on genuine factor differences, we repeat the same portfolio construction but do so within each of the 11 GICS sectors to build sector-neutral or “sector-adjusted” (SA) factor portfolios. This allows us to focus on genuine factor effects rather than confusing sectors with factors.
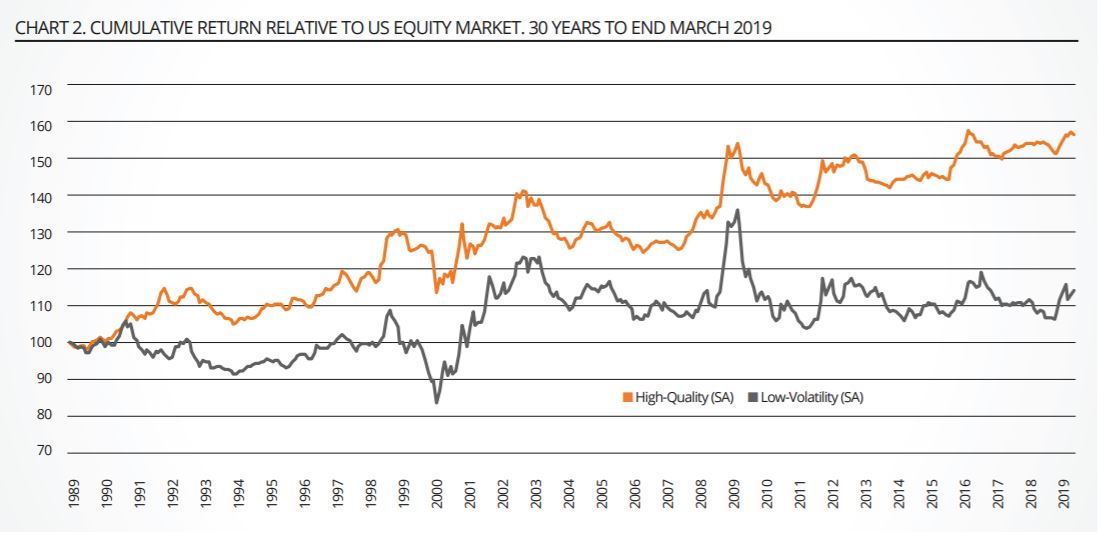
Chart 2 shows longer-term cumulative performance of the sector-neutral High Quality and Low Volatility strategies over the past 30 years. High Quality has significantly outperformed Low Volatility, even though these two strategies have had a fairly high market-relative correlation of 0.7 over the past 30 years.

Chart 3 shows the average monthly relative performance of each strategy over the last 30 years in up and down market months. This shows that both strategies do better when the market is down than up. Low Volatility provides more downside protection although it suffers more in the up-market months that have been dominant in US equities over the past 30 years.

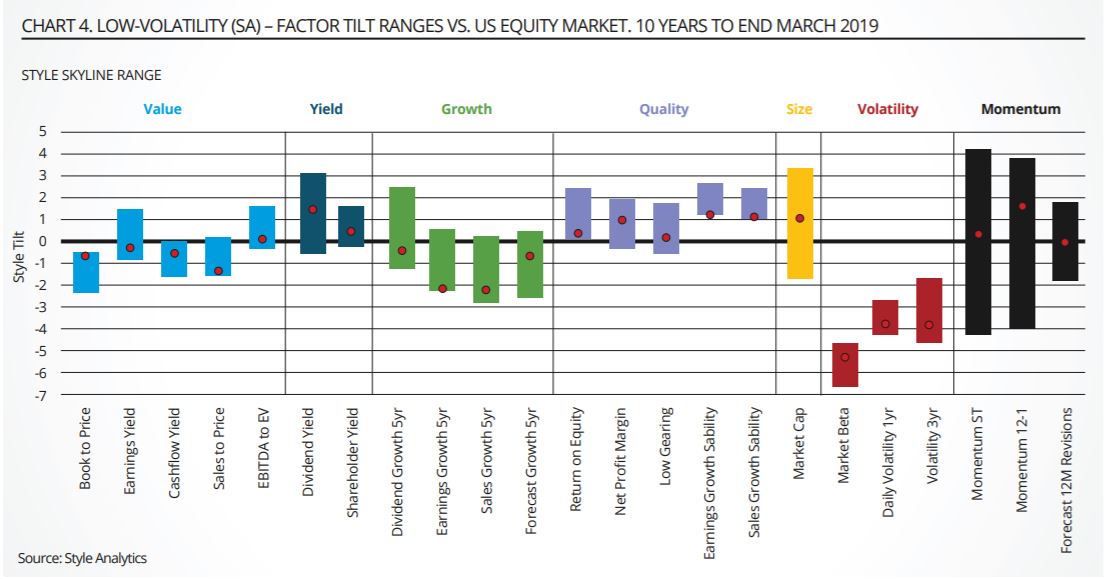
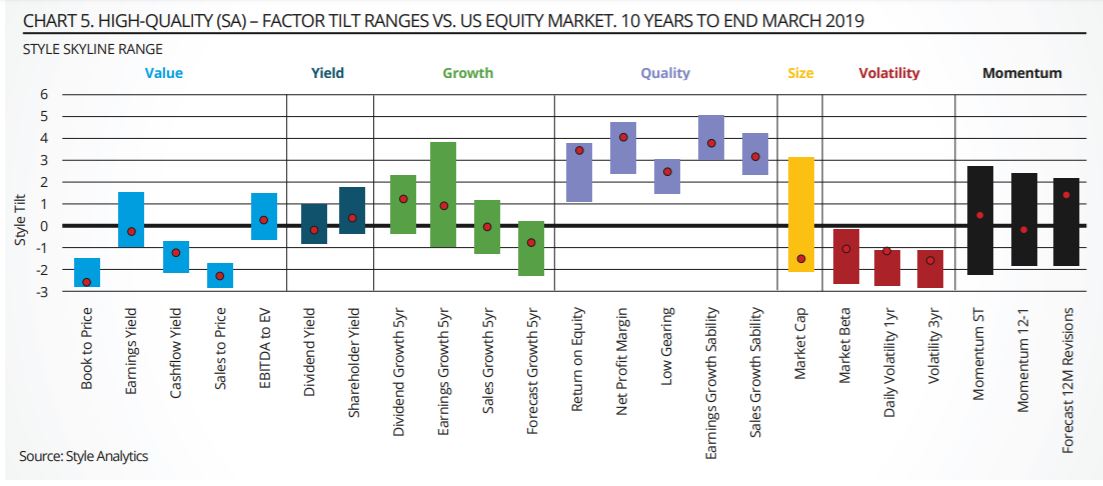
Examination of the range of factor tilts for each of these strategies versus the US market over the past 10 years to end March 2019 is revealing.
Using a holdings-based analysis of the Low Volatility strategy, Chart 4 confirms the constructed tilts away from volatility (red bars). The red markers show the tilts as at end March 2019. However, it is also interesting to see that Low Volatility has typically shown a positive quality orientation (purple bars) together with a bias to high yield (dark blue bars) that is often associated with low volatility. Low Volatility has almost always been expensive on the value measures (light blue bars) of book-to-price, cash flow yield, and salesto-price, although less so on earnings yield and EBITDA-to-EV. Low Volatility is also currently showing strong momentum (black bars) based on
the previous 12 months of stock returns.

Chart 5 shows that, as well as the constructed bias to high-quality factors (purple bars), the High Quality strategy also confirms an orientation to lower volatility (red bars). High Quality has been typically more expensive than the market on similar value factors to Low Volatility but to a higher degree, consistent also with a stronger historic growth bias (left green bars). As at end March 2019 (red marker), High Quality is also biased to stronger upward estimate revisions (rightmost black bar) compared with the US market, reflecting analysts’ current optimism for quality companies.

FINDING FUNDS WITH DEFENSIVE FACTORS
We used Style Analytics Peer Insights to filter ETFs in the Morningstar US Large Cap Universe based on the same low volatility and quality definitions above applied to a holdings-based analysis of the entire universe. We screened down to around 20 funds for each style, and summarised the resulting fund names by word frequency in a word cloud. Charts 6 and 7 show the results for the Quality screen and the Low Volatility screen respectively.

It seems that the names of the more defensive US Large Cap ETFs in terms of quality and low volatility do generally corroborate how the funds are actually oriented based on their underlying holdings, although there are some fund names that may not reveal their defensive nature so directly. The High Quality screen also selects funds labelled as Growth, and the Low Volatility screen tends to also select dividend funds.
Interestingly, there were only two funds that met both of these particular High Quality and Low Volatility screens as at end March
2019:- the SPDR MSCI USA StrategicFactors ETF (QUS) and the VictoryShares Dividend Accelerator ETF (VSDA).
Overall, despite some correlation between low volatility and quality, ETFs exposed to these defensive factors do have quite different
holdings - it is not the case that similar funds are simply being disguised by different fund names. Investors who want to get defensive need to further validate and compare funds, and demand transparency to the underlying factor ingredients. This will help to ensure the best fund fit for their investment views.
Bernie Nelson is President, North America, at Style Analytics
This article first appeared in the Q2 edition of our new publication, Beyond Beta. To receive a full copy, click here.


