Earlier this week in New York, 16 year old Kyle Giersdorf from the US earned himself $3m after winning the solo event in the
world cup finals for the popular video game Fortnite
.
Some 40 million players competed to qualify for the championship which offered a record $30m in prize money shared amongst the winners and is this figure is expected to be beaten in a similar competition taking place in August.
But what if you are not good enough to win the seven-digit prize money but want to make a pretty penny on the industry instead? Well, there are a few ETFs to pick from which can offer just that.
The VanEck Vectors Video Gaming and eSports ETF (ESPO) and the ETFMG Video Game Tech ETF (GAMR) are both comprised of companies from all around the world which utilise the video gaming industry. So which one reigns victorious?
ETFVanEck Vectors Video Gaming and eSports ETF (ESPO)ETFMG Video Game Tech ETF (GAMR)AUM$30.4m$86.7mBenchmarkMVIS Global Video Gaming and eSports IndexEEFund Video Game Tech IndexManagement fee0.60%0.75%Inception date16/10/201809/03/2016
Investment strategy
ESPO tracks the MVIS Global Video Gaming and eSports index which includes companies involved in video game development, eSports and related hardware and software with a market cap greater than $150m. It only has 25 holdings which means each stock has a relatively large weighting of the fund.
Its largest holdings include Nvidia Corp, Tencent and Electronic Arts (EA) which make up 8.8%, 8.2% and 7.0% of the fund, respectively. The top 10 holdings make up over 60% of the ETF. The US is the greatest exposed country with 37.2%, ahead of Japan with 24.1% and China with 16.2%.
GAMR tracks the EEFund Video Game Tech index and similarly includes companies involved in video game development as well as game and chip manufacturers and game retailers. It has a larger portfolio with a total of 85 holdings.
GAMR is more diversified in comparison to ESPO due to having more holdings, reducing the weightings, and has reduced exposure to the varying geographies. Its largest holdings are Bilibili (2.9%), Keywords Studios (2.8%) and Sciplay (2.7%). The US remains the largest country exposure with 30.5%, ahead of Japan with 20.0% and South Korea with 14.8%.
Nintendo and EA are the only shared top holdings for both ETFs and are also probably the only companies, as well as Activision Blizzard, which are explicitly involved in the video gaming industry which ESPO says it offers exposure to.
The method of market cap weighting means graphic processing designer Nvidia and video sharing website Bilibili are the top holdings for ESPO and GAMR.
First Trust vs Gins-Global: Who controls the sky in Europe?
Cost and tradability
ETFMG’s GAMR is the first video gaming ETF to come to the market, according to the company, which means it comes with the larger management fees of 0.75%. Competitors which are not first to the market must usually sacrifice several basis points to attract investors. Therefore, ESPO underprices GAMR by 15bps, offering a fee of 0.60%.
There is also a significant difference in the ETFs’ average annual premium. ESPO has an average premium of 32bps which is great news if you are trying to sell the fund as you would be selling high but means it is expensive to buy if you are currently trying to add it to your portfolio.
In contrast, GAMR, on average, is trading at a discount of 11bps, making it very cheap to buy but does run the risk of making a loss on returns when it comes to selling out.
Performance
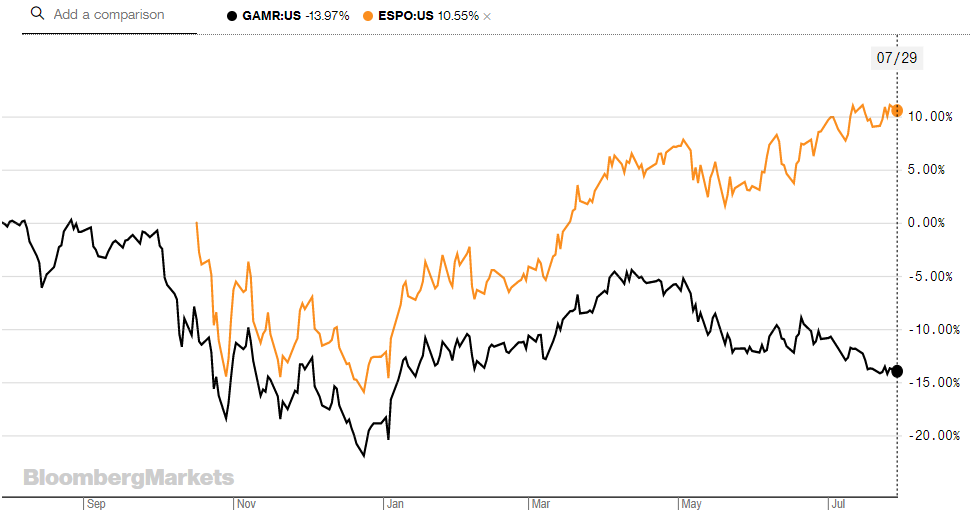
Despite GAMR’s larger number of holdings, its performance has been rather disappointing. Most notably, its performance has dipped ever since the beginning of Q2 2019.
Its three month return is -7.9%, hindering its year-to-date performance to be up by only 7.0%. Heavily affected by the volatile period in Q4 2018, its one-year return is -14.8%.
Alternatively, the newer ESPO has had a great year so far with YTD returns of 26.5%. It was launched in October, in the middle of the volatile period and means it avoided a significant amount of losses which its older competitors suffered. Since its launch, its net asset value has risen 10.6%. Over the same period, GAMR’s NAV has fallen 5.4%.

Conclusion
In ESPO’s factsheet, it states it includes companies with at least 50% of its revenue from the video gaming industry, but when ETF Stream first covered the launch, it was revealed a buffer was put in place which meant this could be lowered to 25%.
While misleading to investors, it is understandable why you might reduce this as the industry is growing upwards of $100bn so any association to the sector is going to be positive.
At first, most were sceptical ESPO would be able to outperform GAMR due to its market cap weighting and limited exposure but its double-digit performance since its launch while competitors are performing at a loss says otherwise. Especially when it offers a significantly cheaper fee.
A final point to add is that GAMR is rebalanced every six months whereas ESPO is done every quarter. This means ESPO is slightly more responsive to market shifts and will reduce exposure if a company's fundamentals significantly change between rebalances.


