[Editor’s note: the discussion below assumes an Australian resident buying IVV and VTS on Australian exchanges.]
For Aussies wanting broad US market access, it is hard to look past iShares S&P 500 ETF (IVV) and Vanguard Total US Stock Market ETF (VTS). Both funds are extremely cheap, liquid and have a lot of money invested in them (which helps eliminate closure risk for long term investors).
But while the two look quite similar, there are important differences investors should know.
TickerFund NameAUM ($M)IVV:AUiShares S&P 500 ETF 3,254.50VTS:AUVanguard US Total Market Shares Index ETF 1,711.77
Investment Strategies
Large caps or total market?
IVV tracks perhaps the world’s most famous index: the S&P 500. Contrary to popular misconception, the S&P is not a straightforward market capper. Rather it tracks 500 companies hand-picked by an S&P committee to represent US large caps. Famous names (like Tesla until very recently) can be excluded at the committee’s discretion.
VTS tracks the total investable US equity universe on a market weighted basis. This means it invests in 3601 investable US companies, with no tilt towards any size or sector. This strategy makes VTS the most perfect example of a purely passive ETF. VTS has tracked indexes from Dow Jones, MSCI and (presently) CRSP throughout its long history.
Structure and its consequences
IVV has a more useful structure
In their Australian form, neither IVV nor VTS is an ETF as such. Rather VTS is a cross-listing of the US-domiciled VTI. (What’s called a “chess depository interest”, in the jargon). While IVV is a feeder fund that invests directly in its US-domiciled parent fund. While this distinction may sound pointy-headed, it has consequences for dividends and tax.
Because VTS is a cross-listing, dividend reinvestment is unavailable. Investors receiving dividends from VTS have no choice but to take cash distributions. They are also required to fill out US tax paperwork every three years. (The hated W8-BEN).
IVV for its part is a fund. And BlackRock have structured it in such a way that dividend reinvestment is available and removed the need to fill out US paperwork.
Tradability
Both highly liquid, discount brokers worse than market makers
Both IVV and VTS enjoy tiny spreads, which ensures it’s cheap for investors to get in and out. The tiny spreads are largely a function of the large ASX trading volume they receive – but also due to the extreme liquidity of their underlying ETFs in the US and the ease with which hedges can be found. (This helps make it easy for market makers to price tightly.)
VTSIVV% Spread0.08%0.06%
The most expensive part of buying and selling IVV and VTS are the spreads charged by brokers. Even discount (i.e. big four bank-owned) brokers in Australia charge upwards of 0.12% per trade. The cost of which typically exceeds the buy-sell spread imposed by market makers.
Fees
3 bps versus 4 bps
VTSIVV% MER (p.a.)0.03%0.04%
The fees of both are so low that they’re basically free. Vanguard introduced a fee cut to VTS early this year, making it one basis points cheaper than IVV. However, in absolute cash terms only investors with tickets of $100 million or more will really feel the difference in fees. (On a $100 million ticket, you’d pay $30,000 in fees to VTS and $40,000 to IVV every year).
As only oligarchs and institutions have that kind of money, and as they tend to negotiate rebates with ETF providers anyway, the difference for Aussie retail investors and their advisors is basically zilch.
Performance
Feel free to cherry pick your timeframe
The performance of these two funds depends almost entirely on the timeframe selected.
Both funds have delivered a strikingly similar performance over the past 10 years, as may be expected given they are both beta products with near identical fees.
The disparity over the last 12 months owes to the strong showing of several large caps. The past year, Chipotle, McDonalds, Microsoft, Visa, Mastercard, Google, Starbucks, have crushed it. These companies are more heavily weighted in IVV and have helped carry it above VTS.
VTSIVV1 year8.70%10.00%3 year16.39%16.69%5 year16.99%17.44%10 year15.94%15.90%
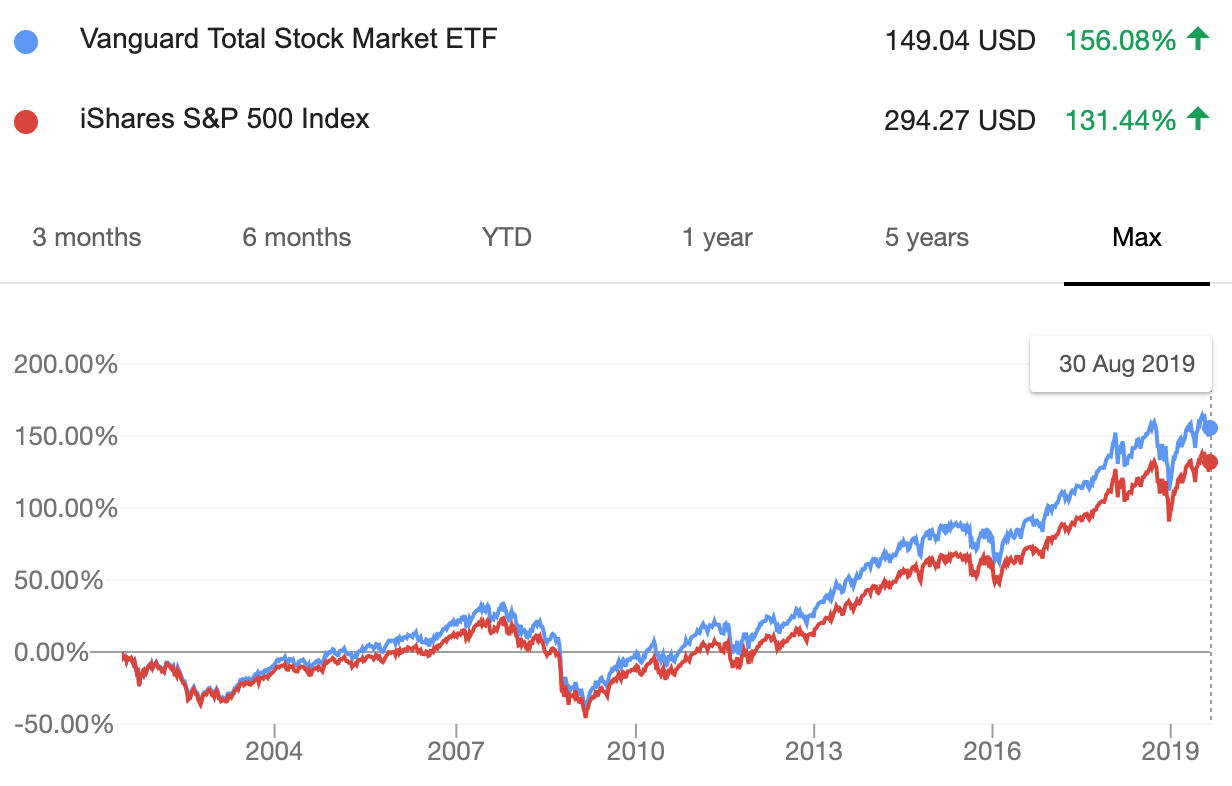
Looking to the United States however, where both these funds underlying ETFs are based, allows for a longer-term view. Since their inception on the New York Stock Exchange over 18 years ago, VTS (NYSE: VTI) has outperformed.

Risk
Market tracking products have market tracking risk
As with performance, the risk measures are very similar. IVV has been slightly less volatile than VTS due to the well-observed tendency of large caps to have more stable share prices. Given that both funds track the broad US market, one should expect market-like risk.
VTSIVV3 Year standard deviation11.6411.195 Year standard deviation11.5811.36Average market cap$64.9 billion$163.6 billion
Verdict
The ASX listings of IVV and VTS provide a really useful shortcuts for self-directed investors and intermediaries. It's always easier to buy ETFs listed on the ASX than on US exchanges.
To my mind, however, IVV is perhaps the easier product to use. It spares the annoyance of W8 BEN forms and allows dividend reinvestment. For investors worried about missing out on small cap and mid cap exposure, BlackRock’s IJH and IJR can fill in the blank spots.


