Large cap US equities have had a good run recently. The S&P 500 rose 20% last year, but this year the gains started to slow with a mere 1.4% uptick in the first half of the year. Things have picked up in the last month or so, but the question is: can US shares sustain their run?
The S&P 500 has now returned 6.9% year to date and is doing better than its European counterparts. The EuroSTOXX 50 is down -0.62% year to date, while the FTSE 100 has gone up 0.38%.
Adam Laird, Head of ETF Strategy, Northern Europe at Lyxor, says: "US equity is a definite positive this year. It's the top performer in the ETF world, with €14bn inflows so far this year - roughly half of all ETF inflows. Technology has been a huge driver of this popularity."
So is technology still the place to be or there are other - better - places to look?
Gains in US tech companies were behind much of the S&P 500's gains over the last 18 months. Performing well in the first three months of the year, it prompted analysts to forecast a 20.5% rise in second-quarter profits for S&P 500 companies compared to a year ago. However, recent earnings have disappointed.
Technology stocks such as Facebook, Twitter and Netflix all saw their share prices drop in July as revenue expectations were missed. Facebook's record breaking 20% one day share price pushed the S&P 500 to fall -0.58% after Facebook announced its quarterly results.
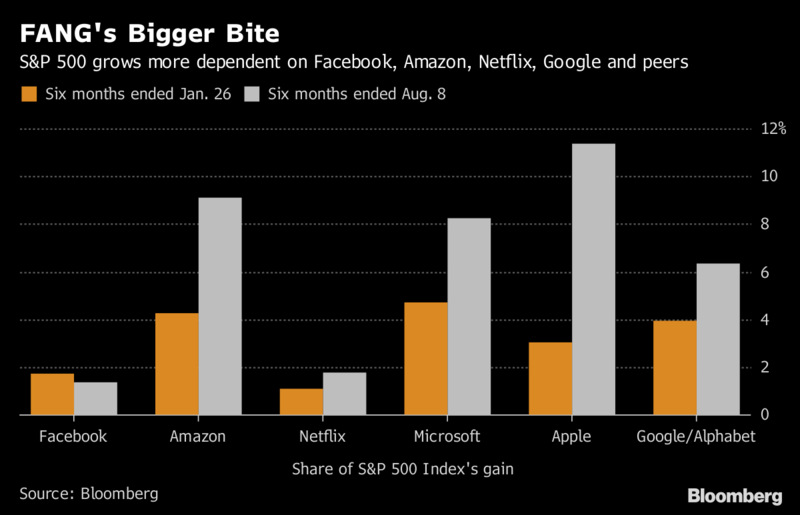
Even so, Facebook's portion of the S&P has still increased to 2.15% from 1.64% four months ago. SeekingAlpha reports that that: "A little over $1 out of every $50 invested in the companies that make up the S&P 500 are invested in shares of Facebook."

Source: Bloomberg
The S&P 500 has relied quite heavily on its FAANG stocks to lift it this year. Apple, Microsoft and Amazon are the three most heavily weighted stocks in the benchmark. Technology stocks make up 26% of the S&P500, according to CNBC. This compares to 15% in the Russell 2000, 16% in the S&P mid cap index and 15% in the S&P small cap index.
Kim Forrest, senior equity analyst at Fort Pitt Capital told CNBC that "The guys at the top don't stay there forever….I don't see anyone displacing them right now, but they do have to make changes to their business models. For example, Facebook has to spend more money to make sure people aren't abusing the platform. Investors like more money, not less."
The outlook for these big international companies is also sketchy. Analysis from UBS shows that a global trade war would knock a fifth off the value of the US stock market, while the S&P 500 could lose as much as 20% from current levels as earnings fall.
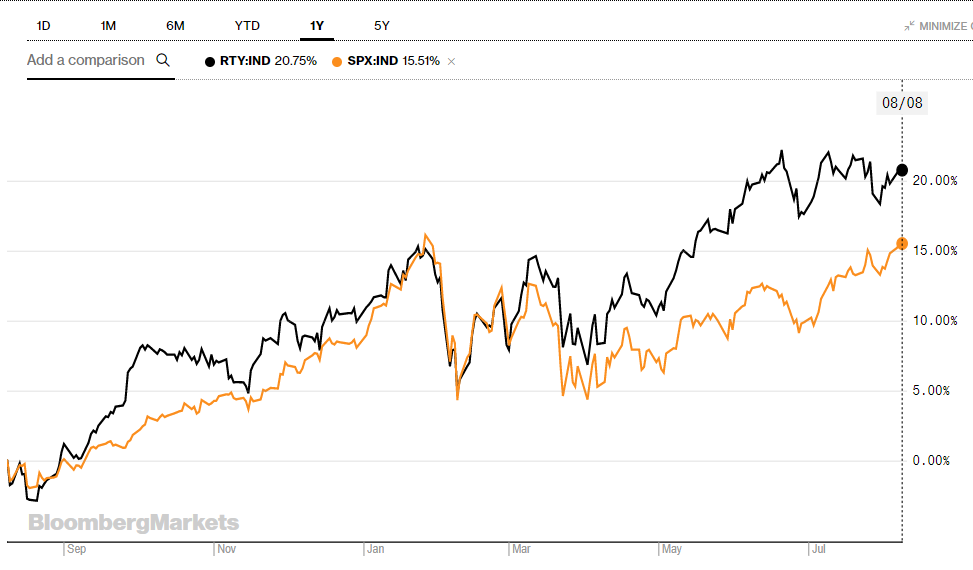
While the S&P 500's run may have slowed, US stocks that have been doing well this year are mid and small caps. The Russell 2000, which is made up of small cap stocks, returned 9.86% this YTD and 22.29% in the last year.
The graph below shows the S&P 500 compared to the Russell 2000.

Source: Bloomberg
There are some good reasons to be positive on these stocks. Firstly, the new US tax reforms means that they get to pay less tax; secondly, they get more domestic revenue than the large cap stocks do; and finally, the economic growth seen in the US is giving them a boost.
Laird says: "In the long run, smaller companies generally outperform. They're riskier but more nimble businesses and investors are often rewarded. This year, US small caps have beaten the larger companies by around 3%. The greater domestic focus of many small US companies also makes them less vulnerable to ongoing trade disputes."
ETFs attached to them are also riding the wave. The Lyxor Russell 2000 UCITS ETF has returned 14.52% YTD. Similarly, other small cap ETFs have done well too. The iShares S&P Small Cap 600 UCITS ETF, which tracks the S&P small cap 600 index, has returned 18.07% this year so far and 25.24% in the past year.
Here is a non-exhaustive list of US small and mid cap ETFs listed on the stock exchange.
YTD RTN
Expense Ratio: 0.35%
Expense Ratio: 0.35%
Expense Ratio: 0.35%
Expense Ratio: 0.35%
ETFTERINDEXLyxor Russell 2000 UCITS ETF (RU2K)0.19%14.52% Russell 2000iShares S&P Small Cap 600 UCITS ETF (ISP6)0.40%18.07%S&P Small Cap 600SPDR Russell 2000 U.S. Small Cap UCITS ETF (R2SC)0.30%13.95%Russell 2000SPDR Russell 2000 U.S. Small Cap UCITS ETF (R2US)0.30%8.80%Russell 2000L&G Russell 2000 US Small Cap UCITS ETF (RTWO)0.45%8.75%Russell 2000L&G Russell 2000 US Small Cap UCITS ETF (RTWP) 0.45%13.81%Russell 2000Invesco Russell 2000 UCITS ETF (RTYS)0.45%8.84%Russell 2000Xtrackers Russell Midcap UCITS ETF (XRSG)M'ment fee: 0.15%14.02%Russell MIDCAP IndexXtrackers Russell Midcap UCITS ETF(XRMU)M'ment fee: 0.15%4.65%Russell MIDCAP IndexXtrackers Russell Midcap UCITS ETF (XRSS)M'ment fee: 0.15%9.59%Russell MIDCAP IndexXtrackers Russell Midcap UCITS ETF (XRSU)M'ment fee: 0.15%8.85%Russell MIDCAP IndexSPDR S&P 400 U.S. Mid Cap UCITS ETF (SPY4)0.30%5.49%S&P MidCap 400 IndexiShares MSCI USA Small Cap UCITS ETF USD Acc (CUSS)0.43%8.42%MSCI USA Small Cap IndexAmundi Russell 2000 UCITS ETF0.35%8.98%Russell 2000


