Stocks are down again today as concerns about high inflation, rising interest rates and slowing economic growth relentlessly weigh on the market.
The sell-off has been ongoing for nearly six months, but the broad market is only just now approaching a key level that may indicate whether the bull market that began in the depths of the COVID-19 lockdowns of 2020 is over.
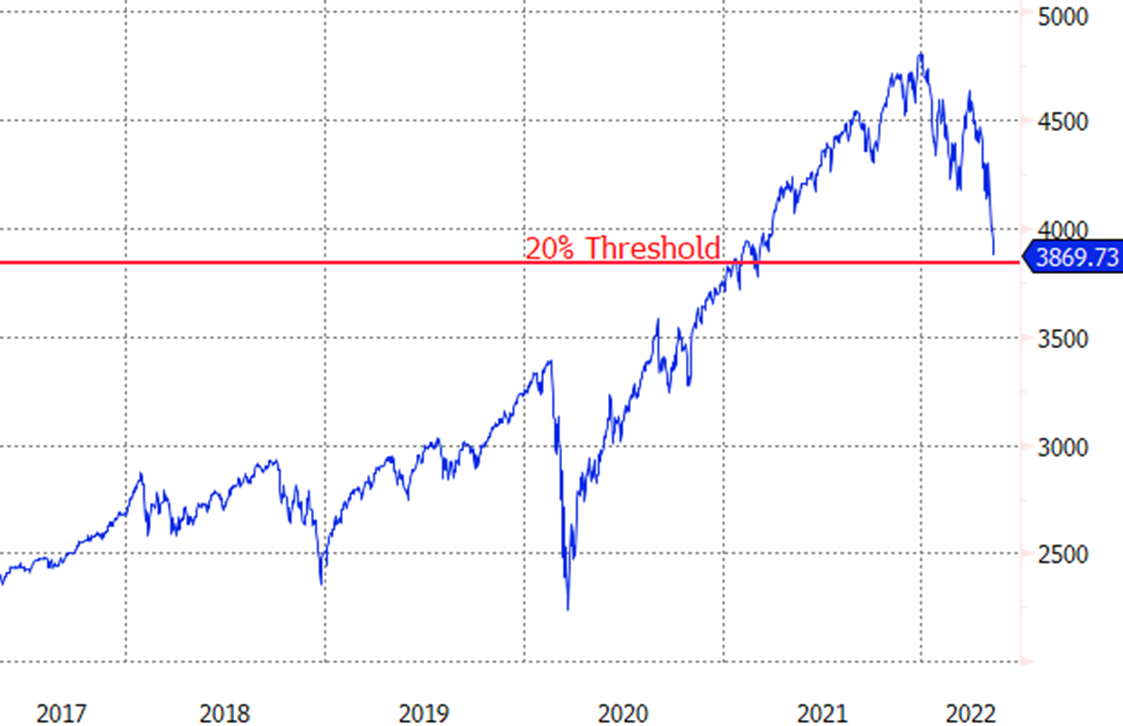
From a high of 4,800 in January, the S&P 500 fell to as low as 3,868 this morning, a decline of 19.4%. According to a popular rule of thumb used by investors, a drop of 20% or more signifies the start of a bear market.
S&P 500 nears bear territory

Source: ETF.com
While a handy heuristic, the 20% threshold does not necessarily tell investors any important information about what to do and where stocks are headed from here.
The cut-off for bull market versus bear market is rather arbitrary. It just as well could have been 30%, or even 40%.
Nor does crossing the threshold suggest anything about the future. It does not indicate how large or how long the ultimate sell-off will be. Nevertheless, if the S&P 500 finishes the day down by more than 20%, it is something that has not happened since the pandemic crash in February and March of 2020.
Before that, you have to go all the way back to the Global Financial Crisis (GFC) of 2008 to see another 20%-plus decline – though there have been a few close calls. In December 2018, the index shed 19.8% on a closing basis before zooming back to all-time highs over the next several months; and in October 2011, during the eurozone sovereign debt crisis, the index fell as much as 19.4%.
Spooky history
It’s true that in recent history, declines in the S&P 500 that exceeded 20% on a closing basis tended to get significantly worse. We saw that happen during the pandemic crash, the GFC and after the bursting of the dot-com bubble – but that does not mean it will continue to be the case.
Still, the most recent 20%-plus declines certainly paint a grim picture for future returns.
After the onset of the pandemic caused stocks to drop 20% in March 2020, it took less than two weeks to extend those losses to 34%. If the Fed had not stepped in to stabilise the markets when it did, things could have gotten even worse.
On July 9, 2008, the S&P 500 closed more than 20% from its all-time high as bad news during the financial crisis piled up. The index would go on to extend those declines to 56.8% over the next eight months.
Similarly, the index crossed that line in the sand on March 12, 2001, and the decline continued for another 19 months, reaching 50.8% at its nadir.
However, earlier declines suggest a more in-between scenario is possible. For example, on 22 February 1982, the S&P 500 entered bear market territory. After that, losses only expanded to 27.1% over the next six months.
Then there is the August 1966 example. The S&P 500 only fell another 2% over the next month after falling into bear market territory.
Little solace
None of these historical examples will be much solace to investors in the short term. A near-20% decline is painful, and losses have been even more severe in narrower parts of the market, like tech and growth stocks.
Where and when markets bottom out is anyone’s guess. Inflation remains much too high for comfort, and the Fed is likely to press hard on the monetary brakes until it's under control.
This story was originally published onETF.com
Related articles


