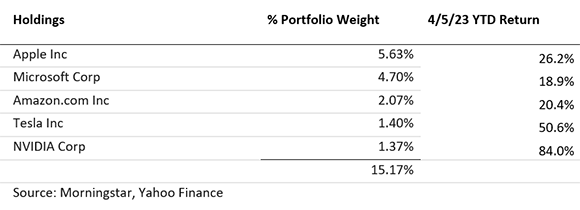
Lately, I have been hearing over and over that indices are masking what is really going on in the market this year. The S&P 500 is up 7%, as at 5 April, while the Wilshire 5000 total market has gained 6.4%. Both are total returns including dividend reinvestments.
Do these returns really mask what is going on in the stock market? Here is my analysis followed by what I think is a clear answer.
According to data from Morningstar, returns were very uneven, with value stocks generally declining while growth did well. Large cap growth was clearly the star. This was a general reversal to last year.

Headlines claiming it is mega-caps driving the market seem to be supported by the data. The five most valuable companies represent more than 15% of the value of all US stocks and gained between 18.9% and 84%.

By my calculations, without these five stocks, the total market would have barely turned in a positive return of only 1.8% instead of the 6.4% of the Wilshire 5000.
Does this mean the indices are distorting what is really going on in the market? Absolutely not. What it means is that those picking parts of the market that underweighted these parts of the market underperformed the entire market. Small cap value and other strategies such as smart beta lagged the market.
If one had merely invested in the market, they could have received the entire market return. The iShares Core S&P Total U.S. Stock Market ETF (ITOT) gained 6.37%, while the Vanguard Total Stock Market ETF (VTI) gained 6.36%. Each follows a total stock index slightly different than the Wilshire 5000.
It so happens that mega caps have driven the returns of the US stock market this year. But that is a very different statement than claiming mega caps distorted the market returns. The latter is merely an excuse the experts are making for underperforming the market. Yet again, those “obviously overvalued mega cap stocks” were actually undervalued.
The fact that a few stocks drove the entire market is not as unusual as you might think. It turns out that the best-performing 4% of listed companies explain virtually the entire net gain for the US stock market since 1926. This is according to research by Hendrik Bessembinder, a professor at Arizona State University’s WP Carey School of Business. The other 96% earn on average the rate of a one-month US Treasury bill.
Whether mega caps will continue to drive market returns or whether small cap value will have their day is a question to which I know that I do not know the answer. I do know, however, that, properly measured, low-cost total US stock index funds must beat the average US dollar invested in US stocks.
So my advice is to harness the knowledge of millions of investors who look at each stock and each part of the stock market to come up with a fair value. Avoid the top-performing ETFs of the past, as they are just as likely to be the worst performers in the future.
Let the experts make their excuses and complain that broad indices mask the market. Owning the market means never having to make these excuses. It also means you will be besting most investors.
Allan Roth is founder of Wealth Logic. He is required by law to note that his columns are not meant as specific investment advice.
This story was originally published on ETF.com


