The importance of getting the asset allocation decisions right has long been ingrained in the thinking of investors and financial professionals. The difficulty has been how to get outside the realm of the subjective and have an approach that delivers consistently. A large body of academic research - much of it by my partners and co-founders of Parala - has long identified that understanding the state of the macro-economy and how it is evolving can be very useful in determining investment asset returns. At Parala, our combined skills and pioneering insights on financial market behaviour has resulted in a state-of-the-art investment methodology able to forecast the movement of security prices by modelling the correlation of macro-economic variables to individual assets and to factors that have been shown to drive market performance.
The methodology is distinguished by its ability to learn and adapt across time and to quickly respond to fast-changing landscapes. It underpins the multi-asset solutions we provide for our institutional clients and the funds we advise.
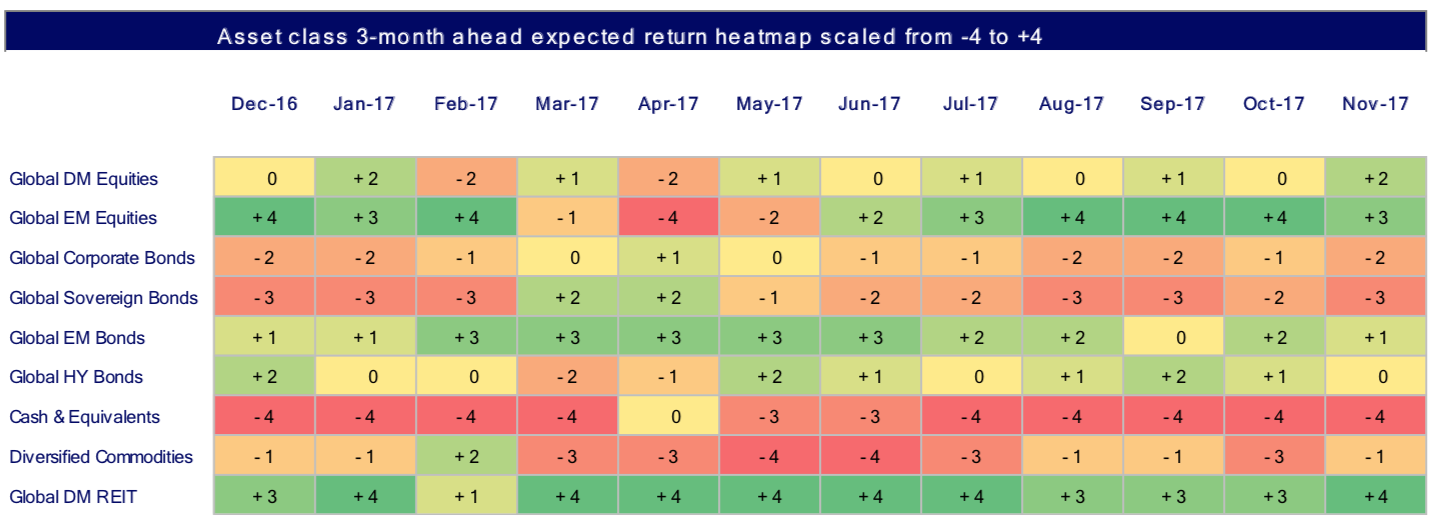
Parala's approach is straightforward and intuitive but one which requires highly complex and proprietary calculations to execute effectively. We've found that a simple way of expressing changes in expected investment outcomes is to use heatmaps. The heatmap below covers nine major asset classes. It shows a three-month ahead view of expected performance from November 2017 as well as the previous forecasts over the last year. Forecasts are updated each month with the latest macro-economic and risk factor changes. In the future, we will extend the analysis to look at the expected performance within specific asset classes. For example, we can look at expectations for the UK, Eurozone, the US and Asian equities.
What are our models telling us about key developments across asset classes for the coming months? A good place to start is considering some of the key macro trends that we have recently observed:
A fall in the USD currency against its major trading partners on a trended basis.
Positive economic growth reflected in year over year increases in commodity prices.
An increase in equity risk aversion which tends to be negative for equities.
Short term rates and inflation trended upward which is negative for fixed assets.
Declining credit risk which is positive for corporate bonds.
These macro variables and many others are part of the information set we use to generate forecasts which can then be distilled into rankings and the heatmap below. A nice thing about the table is that it can be used to assess the relative attractiveness of different asset classes at a point in time as well as trends in individual asset class expectations across time with the more attractive potential returns moving from red to green.

So, what are the observable trends and what might we expect in terms of asset class relative returns over the next three months?
Here are some takeaways:
Global developed market REITs have the most favourable ranking over the coming three months followed by emerging market equities.
Among fixed income asset classes, emerging market bonds have the most favourable prospects, sovereign bonds the least and the prospect for corporate bonds have deteriorated slightly from last month's update.
Diversified commodities improved two places in the rankings along with developed market equities.
In my prior publication, I promised we would take a deeper dive into a specific asset class and this month I've chosen bonds.
What are the key market movers and what can we expect from equities over the coming three months?
EUR corporate and sovereign bonds have the least favourable expected return rankings.
EM and global high yield bonds have the most favourable rankings.
GBP corporate bonds return expectations have fallen the most relative to other fixed income asset classes.
Our state-of-the-art investment model is constantly learning and adapting to changing macro-economic and market conditions. Next month, we will provide an update to our three-month ahead view as taking a deeper look within another asset class such as fixed income or real assets.


