One of the most defining moments in Greek mythology is Titanomachy, the decade-long battle between the older generation of gods, the Titans, and the younger generation, the Olympians.
As is true of all great stories, at its heart is an important lesson: never underestimate how drastically the playing field can change, even in the most unlikely of circumstances, and that against all odds, even the most powerful can fall. Investors in cap-weighted indices would do well to heed the lesson of this fable.
Titans fall
A market-cap index is dominated by companies with the largest capitalisations. Arnott et al. (2018) found that from decade to decade the top 10 holdings of a global market-cap index experienced significant turnover. Regardless of how outlandish it might seem at the time of their dominance, these stock titans inevitably lose their stature. In the late 1980s, big oil took centre stage, only to be completely overthrown in the 1990s by the Japanese conglomerates. Technology and communications companies were the titans of the 2000s yet yielded to the rise of Chinese multinationals a decade later (see Chart 1).
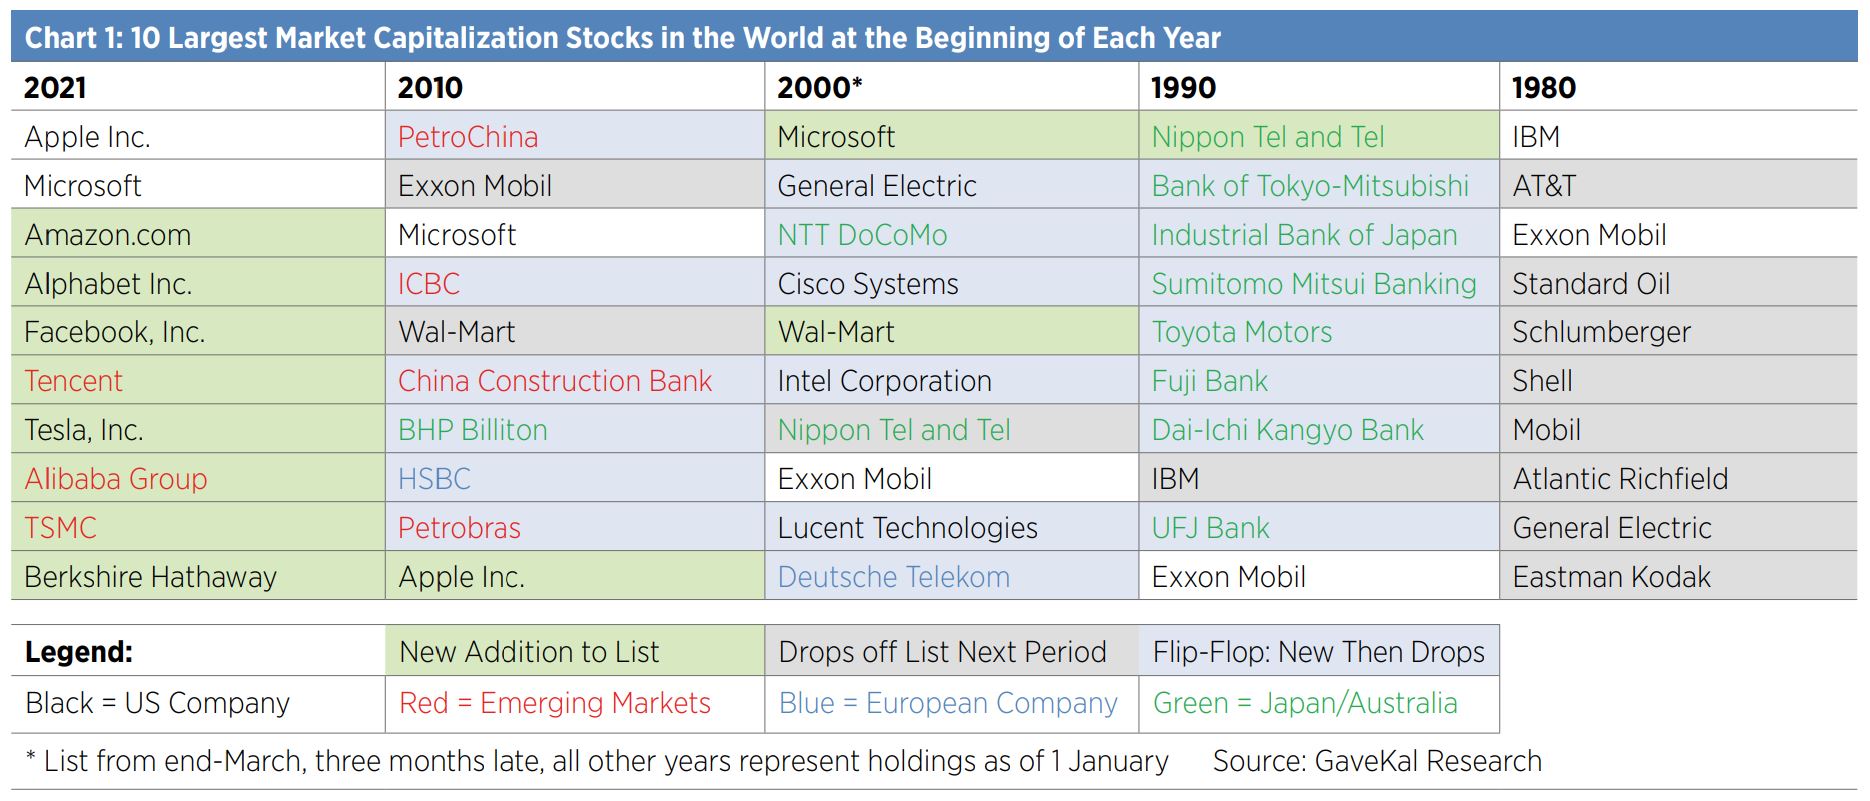
Investors know all too well the remarkable domination by growth stocks of the US and China markets that materialised over the 2010s. Today, however, only Microsoft and Apple remain from 2010 in the top 10 holdings. All other stocks in 2021 are new to the list and are concentrated in the technology and communications sectors. Our history lesson suggests the next decade will bring more turnover. Will any of the current titans still rule in 2030?
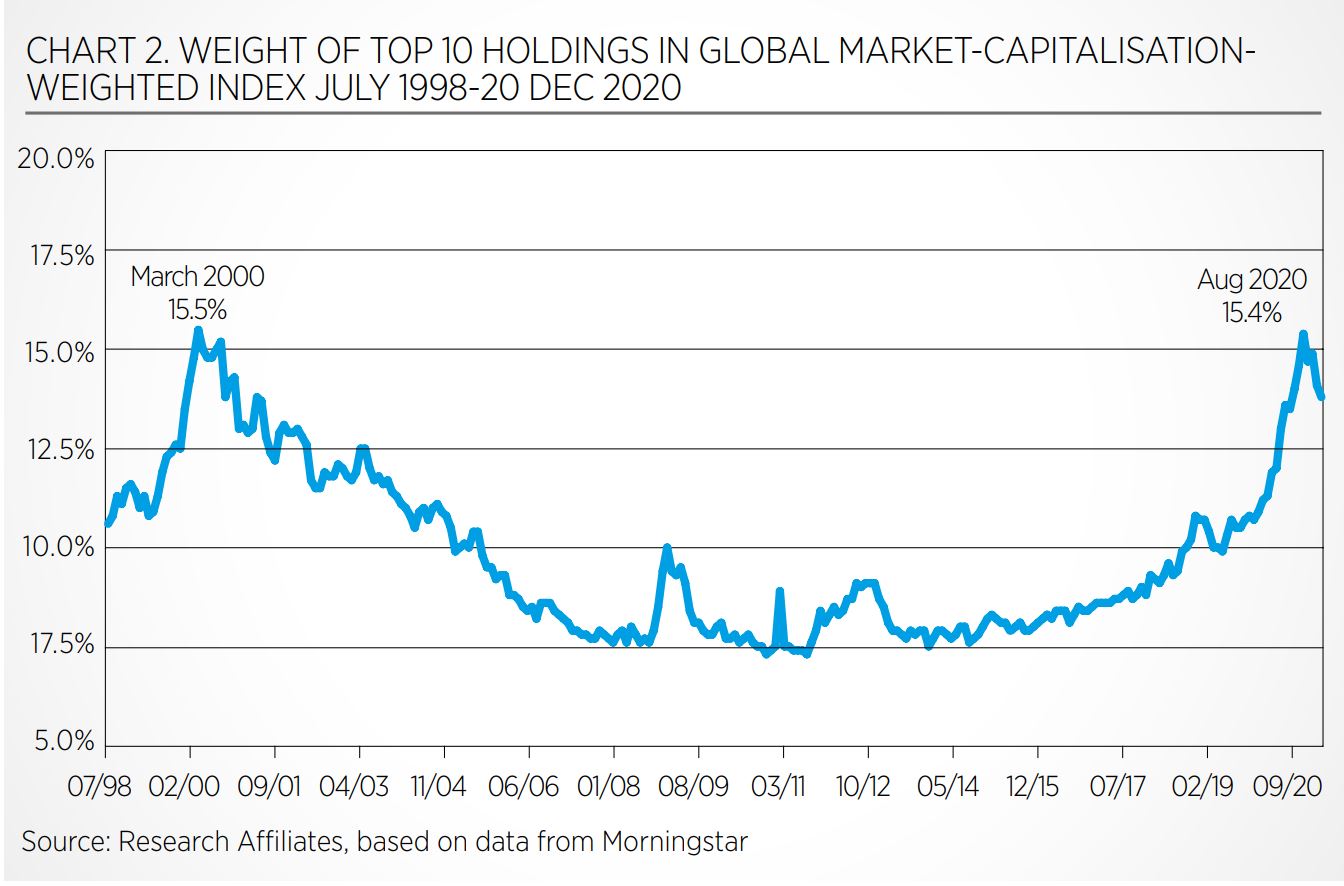
The concentration, or the combined weight, of the top 10 holdings in a market-cap index fluctuates over time. In August 2020, concentration reached a historical peak of 15.4% in the Morningstar Global Markets Large-Mid index, matching the 15.5% concentration level present in March 1999 at the height of the tech bubble. A level this high is not what most investors prefer in a diversified portfolio, because the portfolio’s performance becomes hostage to the performance of these dominant stocks (see Chart 2).
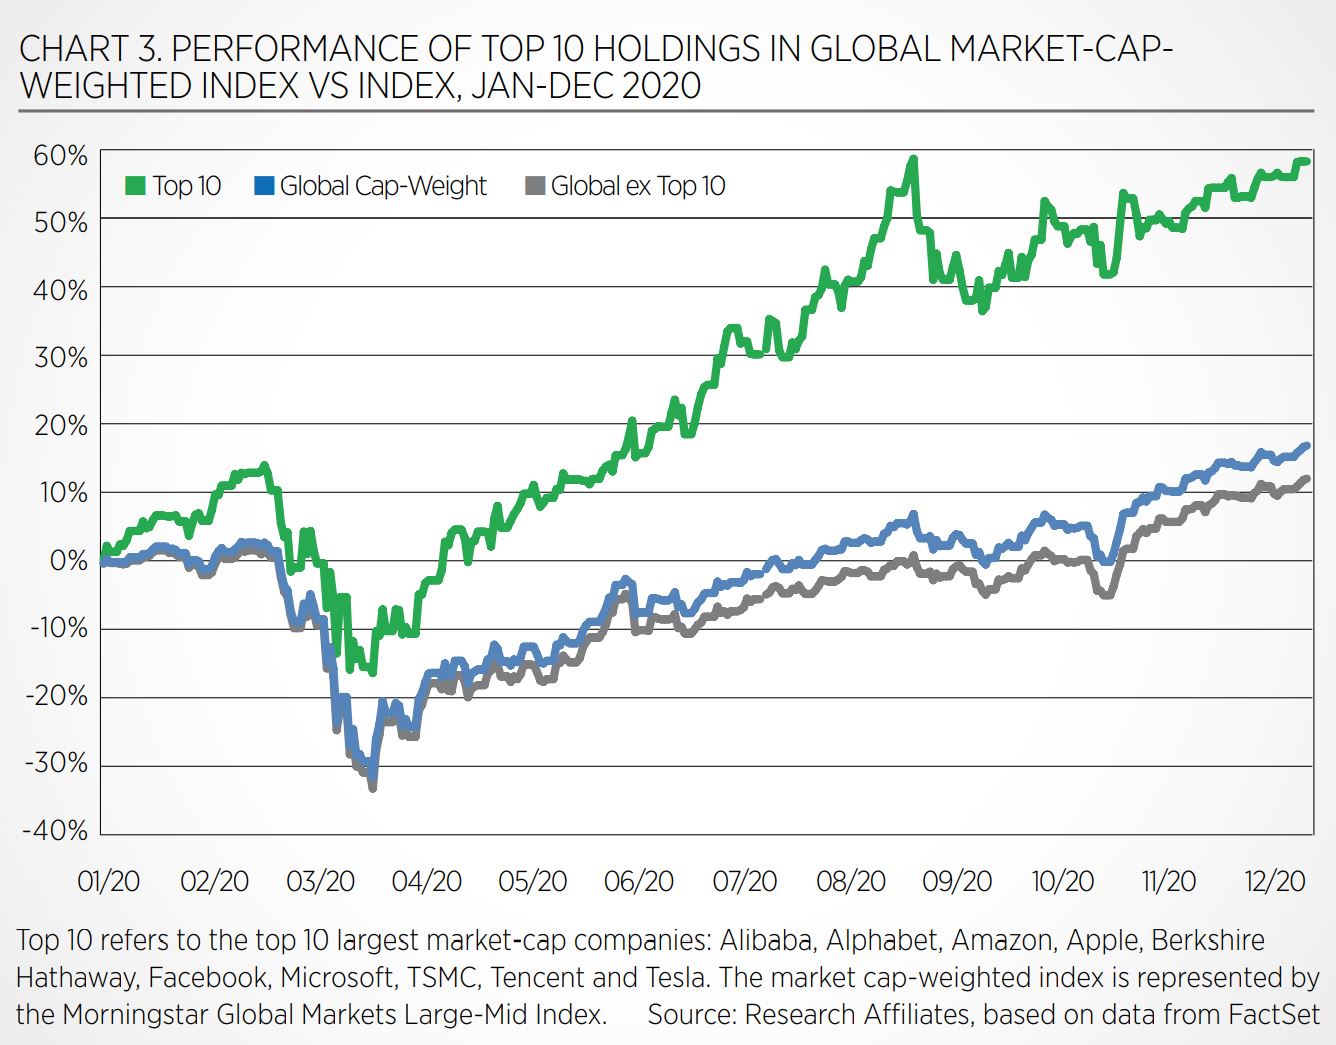
When the top names only go in one direction – up – as they have for so long, the downside risk of concentration tends to be overlooked. Today, the performance of these titans appears to be overextended. In 2020 alone, the top 10 delivered a staggering 58.5%, contributing roughly 5% of the global markets’ 17.2% annual return. If (and we would say, when) prices correct, investors could be in for a painful ride down (see Chart 3).
Most of these top stocks are great businesses. The question is more about whether market hype has overinflated their prices. Although history never repeats itself, it can be a useful guide for understanding investor behaviour. One approach to analyse market exuberance is to compare a company’s clairvoyant value to its historical cap-weight, as was done by Arnott et al. (2009a,b). Nobel laureate William Sharpe coined the term clairvoyant value in 1975. He defined the term as ex-post realised value, or value that can only be determined after the fact, or measured ex-ante only with the perfect foresight of a clairvoyant. Arnott et al. used discounted realised cash flows going back 50 years to calculate clairvoyant value.
To bring more colour to their analysis, Arnott et al. categorised companies using a range of growth to value segments to determine if the market’s predictive ability was consistent across the spectrum, regardless of whether a company was a popular growth company or a traditional value company. With clairvoyant value as a yardstick, they found that investors tend to overly discount value companies and overpay for growth companies.
Given that today’s titans are heavily skewed towards growth companies, coupled with the concentration issue of their dominating a large part of a market-cap-weighted portfolio, the potential for future underperformance of these (likely overvalued) stocks and the portfolios that hold them has merit.
We are all well aware of the exuberance of capital markets and investors’ willingness to overpay for assets versus their perceived intrinsic value. In 2020, however, we witnessed a new twist on the potential for a popular stock’s market price to deviate from its intrinsic value. As Arnott, Kalesnik, and Wu (2021) observed, the 2020 pandemic-related lockdowns contributed to a tremendous rise in retail participation, leading to some very interesting assetprice trajectories over the last 12 months.
Particularly in the US, a growing cohort of “Robinhooders” (nicknamed after the commission-free trading platform Robinhood) have the ability to trade fractions of shares at extremely low – if any – cost. The percentage of shares traded in the US market by retail participants has increased substantially over the last decade, jumping from 15% to 20% in 2020.
The real concern is a meaningful rise in the use of options, which are ultimately levered positions and serve to exacerbate the inefficiencies in the market.
A number of examples are readily at hand that illuminate the effect of increased retail participation in the markets. In the early part of 2020 as offices closed due to COVID-19, the video and web conferencing platform Zoom benefited from the rapid transition to virtual meetings. Unsophisticated investors rushed to buy the stock with the ticker ZOOM, not recognising the Zoom Video Communication’s ticker is ZM. ZOOM was Zoom Technologies, a Beijing-based company that had zero to do with virtual meetings. The surge in demand sent its stock price up 1000%!
Once the realisation kicked in for investors that they had bought the wrong stock, Zoom Technologies’ price quickly collapsed (Wieczner, 2020).
Another recent buying frenzy occurred after Elon Musk tweeted in January that his followers should move from WhatsApp to the new messaging app Signal. Signal was developed by the nonprofitSignal Foundation and is not a publicly-traded company. Not to be deterred, Musk’s followers charged headlong into speculating in shares of a company called Signal Advance, which focuses on healthcare tech and has absolutely nothing to do with the messaging app. The episode caused a 1500% meteoric rise in the Signal Advance share price (Ho, 2021).
Overall, the increasing numbers of retail investors are gravitating to the success stories of the popular growth stocks, putting even more pressure on the titans’ prices. As of December 2020, top 10 companies had a weighted average valuation multiple of 51.4, five times higher than the rest of the global equity universe (see Chart 4).
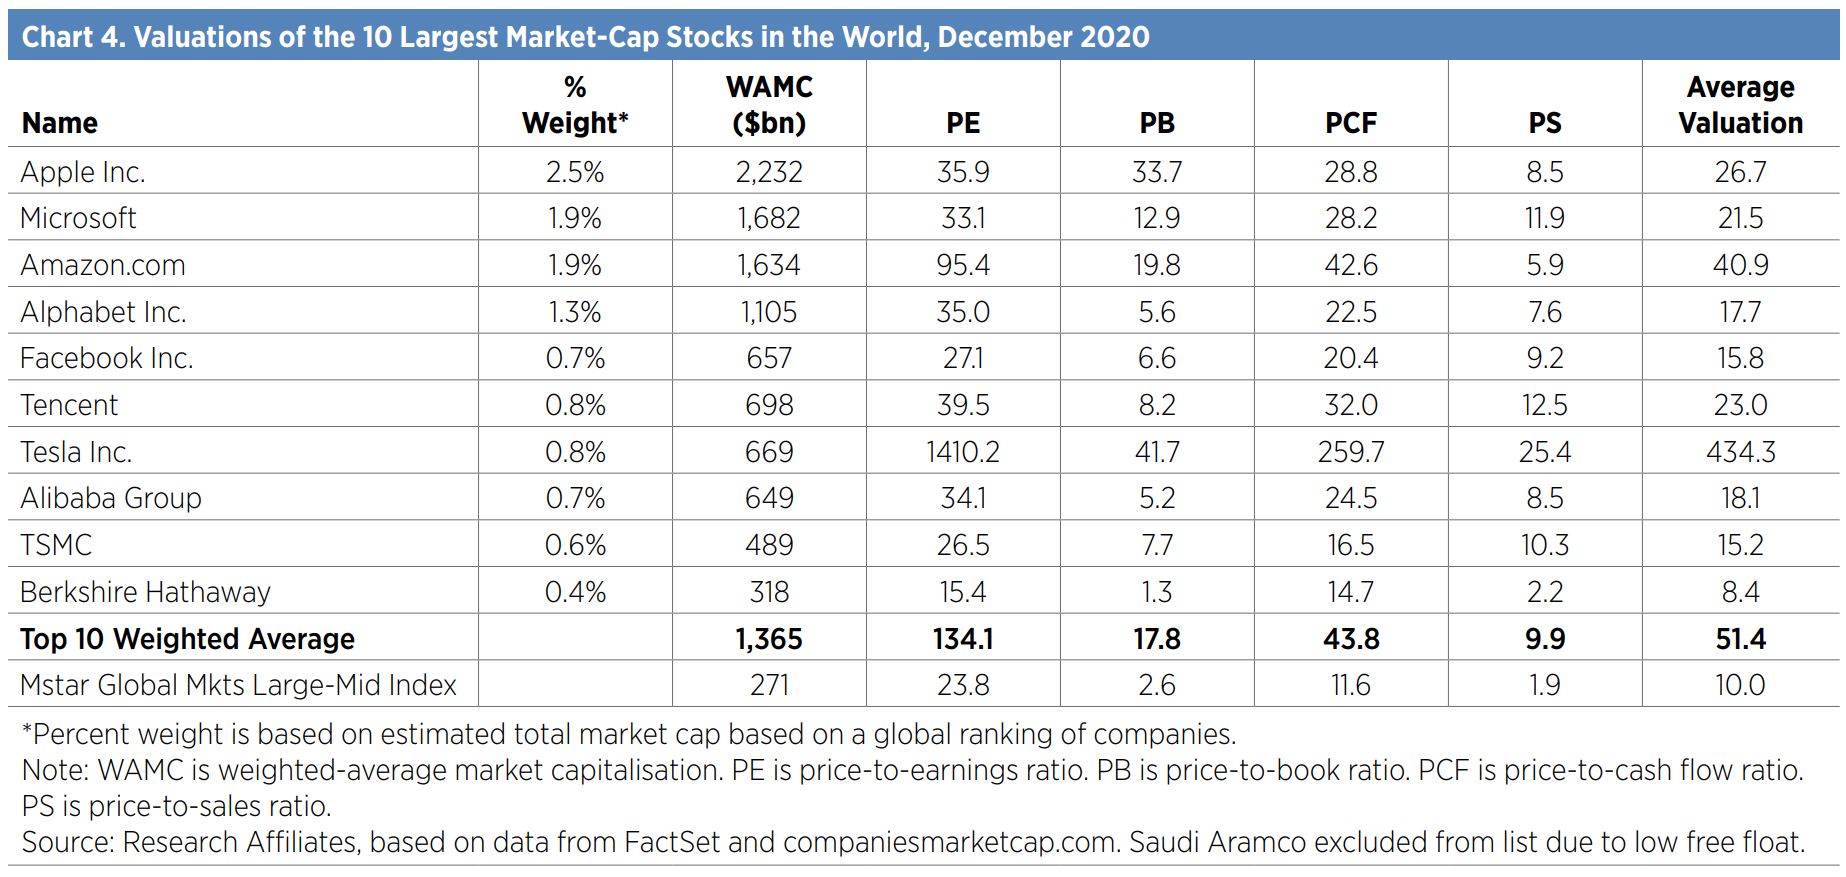
Some market participants argue that low (and even negative) interest rates can justify higher equity valuations. Nevertheless, valuation multiples that are so out of line with the market average, combined with the growing market influence of unsophisticated investors, is cause for concern.
The Olympians? Factor investing
Investors worried about the implications of concentration in overvalued stocks and pricing inefficiencies have options that tend to mitigate these concerns. Smart beta multi-factor strategies can improve portfolio diversification across both asset holdings and investment styles and do so in a transparent manner and at a cost-effective price.
Factor investing strategies have been around for decades and are supported by a substantial body of academic literature. A factor is a company attribute that has been shown over time to deliver a return premium to investors. A very popular factor and one hotly debated today is value. The value factor essentially selects the cheapest companies based on one or a combination of valuation ratios to form a portfolio of value stocks. Periodically refreshing, or rebalancing, the portfolio by adding newly cheap stocks and discarding appreciated stocks helps retain the attractive value exposure.
Other popular factors are quality, low volatility, momentum and small size. Each alone has more volatile performance than when combined with other factors in a portfolio because a factor’s performance tends to ebb and flow through economic cycles (see Chart 5).
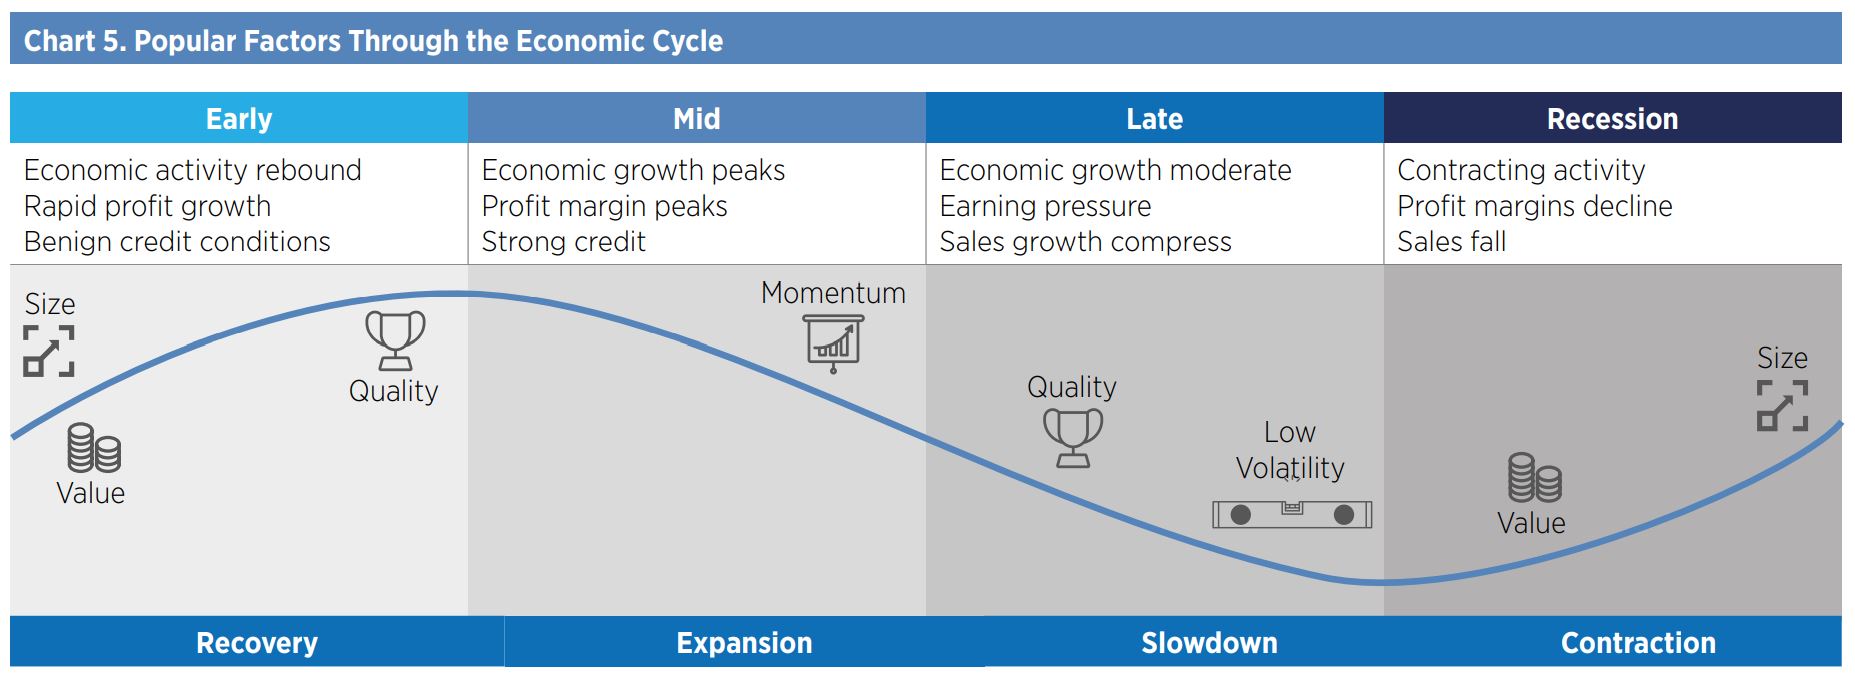
Source: Research Affiliates
Over the long term, however, these popular factors have shown an ability to deliver a superior risk-adjusted return over the market’s return. A multi-factor strategy aims to capture the return premiums from each factor while smoothing out the performance ups and downs through diversification.
A multi-factor strategy is less prone to severe crashes when compared to a factor in isolation. The top 10 holdings of the market benchmark, which can be thought of as a traditional passive allocation, totalled 17.5% as of 31 December 2020.
Blending in a 25% allocation of a multi-factor strategy reduces the concentration to 14.4% and increases expected long-term excess return by 0.5%. Increasing the allocation to 50% reduces concentration risk to 11.9% and improves the expected-return profile by 1.0%. In both of these blended portfolios, tracking error is below 2.0%. A more-aggressive allocation of 75% to a multi-factor strategy drops the concentration to 9.6%, keeps tracking error below 3.0% and raises the historic excess return by 1.5% (see Chart 6).
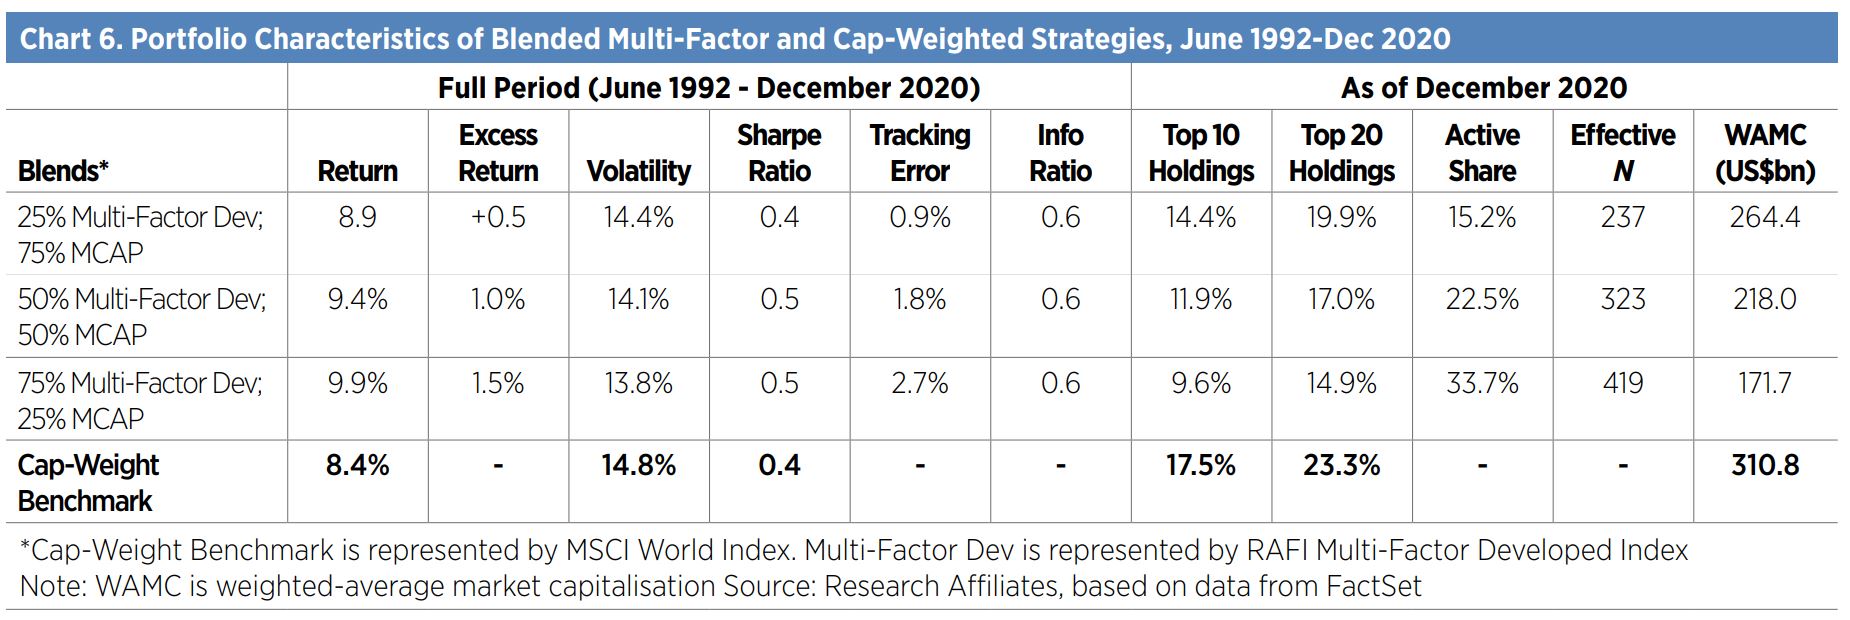
Investors who incorporate a multi-factor strategy in their passive allocations not only reduce their dependency on these large titan stocks but can harness the return premiums from well-researched investment factors.
The result is a better-diversified passive core allocation with the potential for generating return in excess of the market over the long term.
Conclusion
The top-dog stocks today in a market-cap-weighted index have healthy cash flows, so that envisioning they may not stand the test of time can take a healthy imagination. Nevertheless, in the same way the Greek Titans believed their rule was safe, the tables can turn.
A half-century’s history shows that the market’s titan stocks constantly change. Investing in today’s titans is especially risky because their concentration is at the same level as during the dot-com bubble and their valuations are five times that of the market.
These concentration risks can end in tears. For investors who prefer to remain well diversified and to mitigate these high and dangerous concentrations, a blended smart beta multi-factor approach can be an attractive solution.
Joe Steidl is senior vice president, Europe, at Research Affiliates and Tiffany Su is a senior analyst at Research Affiliates
This article first appeared in the Q1 2021 edition of Beyond Beta, the world’s only factor investing publication. To receive a full copy,click here.
ReferencesArnott, Robert D., Feifei Li, and Katrina Sherrerd. 2009a. “Clairvoyant Value and the Value Effect.” Journal of Portfolio Management, vol. 35, no. 3 (Spring):12–26.Arnott, Robert D., Feifei Li, and Katrina Sherrerd. 2009b. “Clairvoyant Value II: The Growth/Value Cycle.” Journal of Portfolio Management, vol. 35, no. 4 (Summer):142–157.Arnott, Rob, Vitali Kalesnik, and Lillian Wu. 2018. “Buy High and Sell Low with Index Funds!” Research Affiliates Publications (June).Arnott, Rob, Vitali Kalesnik, and Lillian Wu. 2021. “How COVID-19 Vaccines and Brexit Create the Trade of the 2020s.” Research Affiliates Publications (February).Ho, Karen. 2021. “A Misinterpreted Elon Musk Tweet Sent an Obscure Stock Soaring.” Quartz.com (January 12).Sharpe, William. 1975. “Likely Gains from Market Timing.” Financial Analysts Journal, vol. 31, no. 2:60–69.Wieczner, Jen. 2020. “‘ZOO


