Nicolas Rabener, managing director of FactorResearch, studies the potential benefits of an allocation to emerging market debt in terms of both a performance and diversification perspective.
Introduction
Forecasting the short-term outlook for the S&P 500 is like predicting the weather in Scotland. The likelihood of getting it right is not particularly high and anything can be expected. However, evaluating the long-term prospects of a stock market seems to be a function of its valuation. It is not a perfect relationship, but the higher the multiple on average, the lower the subsequent return over a 10-year time horizon.
In fixed income, forecasting returns is somewhat easier as the current yield is a significant indicator of the long-term total return. Stated differently, what you see is what you get. Unfortunately for pension funds, insurance companies, and savers in general, bond yields are currently negative or extremely low in most developed markets.
Investors seeking yield, diversification, or both, could turn towards emerging market (EM) bonds. The consensus is these offer higher expected returns given more risk than bonds of developed markets, although capital market assumptions vary significantly across financial institutions. JP Morgan expects long-term returns of 5.3% for EM debt, compared with only 1.6% by GMO.
Factor investing in emerging markets
Unfortunately investing in emerging market debt is complicated as it is a complex asset class. Bonds are issued by countries and companies, either in local or hard currency, which is typically in the US dollar. The universe of available instruments includes mutual funds, ETFs, and single bonds.
Adventurous investors have provided financing for Mozambique’s fleet of tuna-fishing boats in 2016 and granted Argentina with capital for a century in 2017, shortly after the country emerged from a debt restructuring.
In this short research note, we will contrast emerging market government versus corporate debt and investigate if an allocation would have been accretive for a traditional US equity-bond portfolio in recent years.
Emerging market debt performance
We focus on emerging market bond ETFs issued in the US, which mostly track benchmarks such as the JP Morgan Emerging Markets Bond index. The ETFs have approximately $30bn assets under management (AUM) and charge on average 40 basis points of management fees per annum.
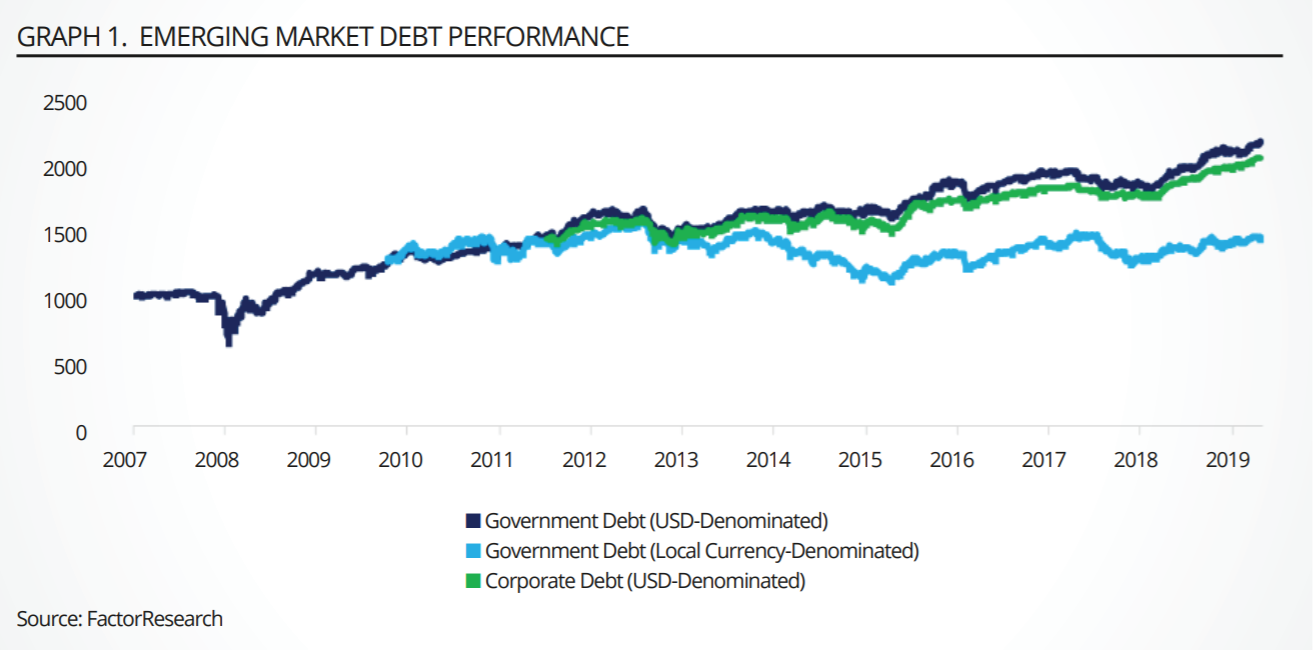
We create three equal-weighted indices that represent the three types of EM debt. Only EM government debt denominated in USD has a sufficiently long track record that covers a complete market cycle. We observe that these bonds had a 29% drawdown during the Global Financial Crisis from 2008 to 2009, which raises the question of the attractiveness of EM debt from a diversification perspective.
Contrasting government versus corporate debt shows that these generated similar performance from 2012 to 2020, if denominated in USD. Local currency-denominated government debt performed significantly worse from 2013 onward, which can be explained by the strong performance of the USD against almost all other currencies (see graph 1).
Emerging market debt characteristics
Most investors will be familiar with many of the constituents of the S&P 500. Stocks like Microsoft, General Electric, or Goldman Sachs are household names. However, there is likely less familiarity with countries such as Bahrain or Sri Lanka and companies like OCP or Banco de Bogota.
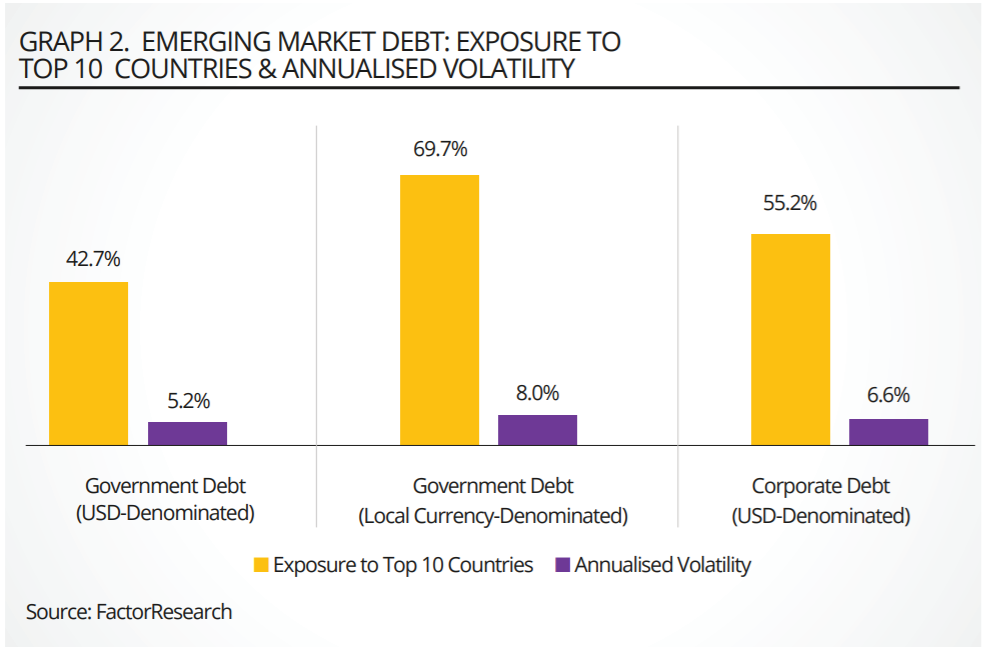
The easiest approach for investors to manage country or company risk is by diversifying. Aggregating the exposure to the top 10 countries reveals that USD-denominated EM government debt is significantly more diversified across countries than the local currency-denominated government or corporate debt, which likely contributed to the lower volatility in the period from 2012 to 2020 (see graph 2).
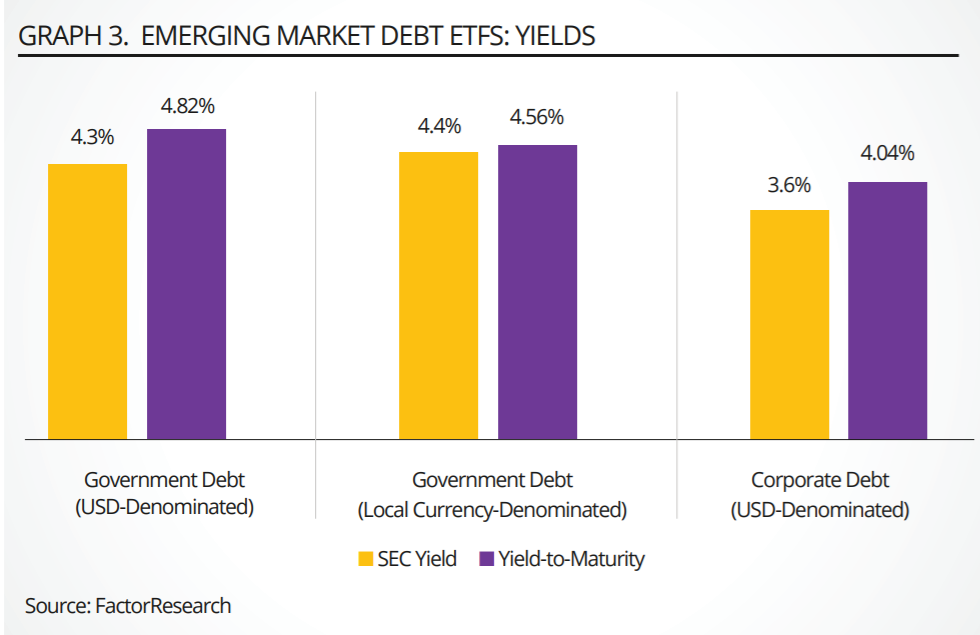
Despite USD-denominated EM government debt being less exposed to a few countries and exhibiting lower volatility, these bonds are not trading at lower yields that would indicate higher credit quality. The average credit rating for all three types of EM debt is BB, according to Morningstar.
EM corporate debt is currently offering the lowest yields, which indicates that investors have more faith in corporate than sovereign credit. However, it is worth noting that the EM corporate debt ETFs include some issuers from developed markets like Hong Kong, Singapore, and Taiwan, which represent less credit risk. Companies like the Singaporean telecom provider Singtel or property firm Global Logistic Properties operate in emerging markets but are not typically classified as emerging market companies (see graph 3).
Emerging market debt for diversification?
The analysis highlights that investors would have been better off buying USD-denominated EM debt in recent years, regardless if from governments or corporates. However, this perspective is backward-looking, and the USD might underperform going forward, which would make local currency-denominated bonds more attractive for US investors.
Furthermore, yields and credit quality are comparable across the types of EM debt, which further adds to the complexity of evaluating EM bonds as an investment opportunity.
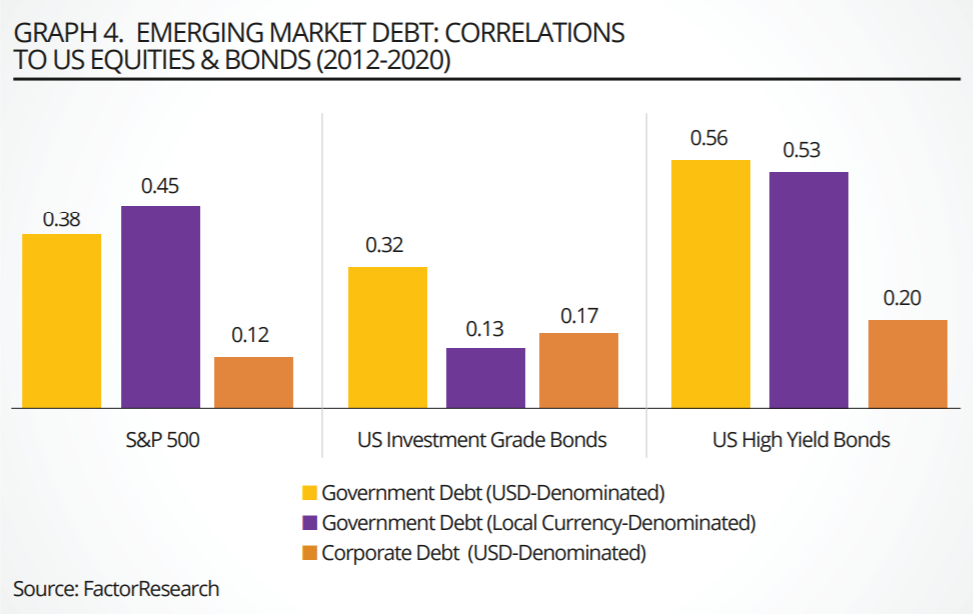
From a diversification perspective, investors should prefer strategies that feature low correlations to traditional assets. We calculate the correlations to the S&P 500, US investment grade bonds, and US high yield bonds in the period from 2012 to 2020. EM corporate debt was most attractive for diversification given the lowest correlations while EM government debt was highly correlated with US high yield bonds, which suggests investors view these as similar instruments (see graph 4).
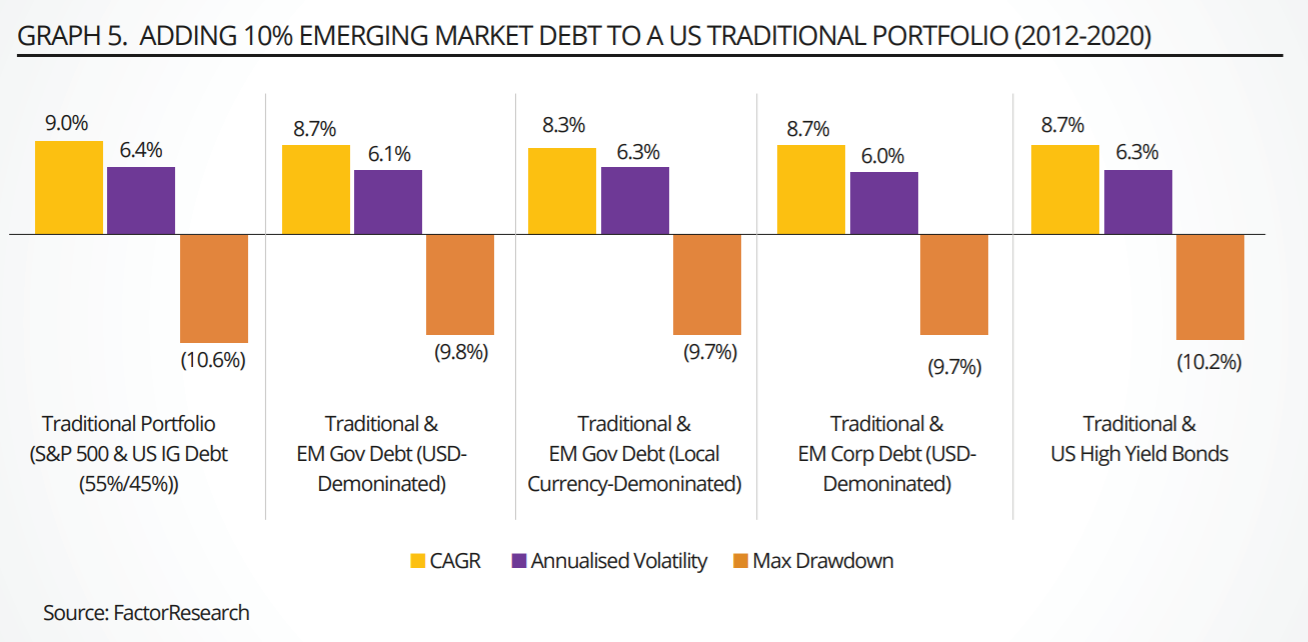
Finally, we simulate how accretive a 10% allocation to EM debt would have been for a traditional US equity-bond portfolio from 2012 to 2020. We observe the return decreased in all cases, which is simply explained by less exposure to the S&P 500, which outperformed almost all asset classes in recent years. However, the portfolio volatility decreased further, which results in slightly higher risk-adjusted returns when including EM debt.
We also provided a scenario with a 10% allocation to US high yield bonds given the high correlations to EM debt, which also would have increased risk-adjusted returns, but not reduced the maximum drawdown as significantly as EM debt. US high yield debt is more correlated to US equities and bonds than EM debt and therefore provided fewer diversification benefits (see graph 5).
The analysis can be challenged given that we mainly focused on the period from 2012 to 2020, which effectively represents a bull market in equities as well as bonds and therefore only a part of a complete market cycle. However, there is a longer data history available for USD-denominated EM government debt, which includes the global financial crisis from 2008 to 2009.
Evaluating the benefit of a 10% allocation to this type of EM debt highlights an increase in risk-return ratios from 0.90 to 0.96 for a traditional US equity-bond portfolio and a reduction of the maximum drawdown from 28.7% to 27.1%.
Further thoughts
Given high levels of public, corporate, and household debt, as well as poor demographics in most developed countries, inflation and economic growth is likely to remain low for the foreseeable future. It is challenging to see interest rates and bond yields in developed markets rising significantly in such an environment, which should continue to keep the interest in highyielding EM debt elevated.
An allocation to EM debt has been accretive for US investors and is likely superior to US high yield bonds given lower correlations to traditional assets. However, there are strategies like managed futures or liquid alternative products that offer higher diversification benefits.
It is also worth noting that many emerging markets feature the same structural issues as developed markets. For example, China, which features prominently in the EM debt ETFs, has one of the highest debt-to-GDP ratios globally as of today, but is expected to lose 400 million people until 2100. Paying interest and repaying debt will become challenging over time.
Nicolas Rabener is managing director of FactorResearch
This article first appeared in the Q1 2020 edition of Beyond Beta, the world's only smart beta publication. To receive a full copy, click here.


