Investors have been mining emerging markets (EM) for opportunities ever since they became a distinct investment class several decades ago. But weaker performance and challenging geopolitical developments may obscure these conviction plays, potentially resulting in shrinking exposures.
To gain a clearer picture of what these markets have to offer, we revisit the fundamentals – analysing valuations, demographic and other data that may help detect new sources of return in these rapidly-growing economies around the world.
Expanded opportunity set
Using our market classification system, which considers economic development, size and liquidity as well as market accessibility, MSCI has classified 23 countries as developed markets¹ and 24 as emerging markets.²
That means that investors not already invested in EM can significantly increase their potential sources of return simply by allocating to EM, gaining exposure to new companies, countries and sectors.
Investors restricted to developed markets have roughly 5,800³ investable companies to choose from. By expanding to EM, that number grows by roughly 3,200.⁴
We can also measure opportunity by examining the distribution of companies by sectors or industries. A granular sector classification such as the Global Industry Classification Standard (GICS)⁵ may provide insights into the main business areas and revenue drivers for companies around the world.
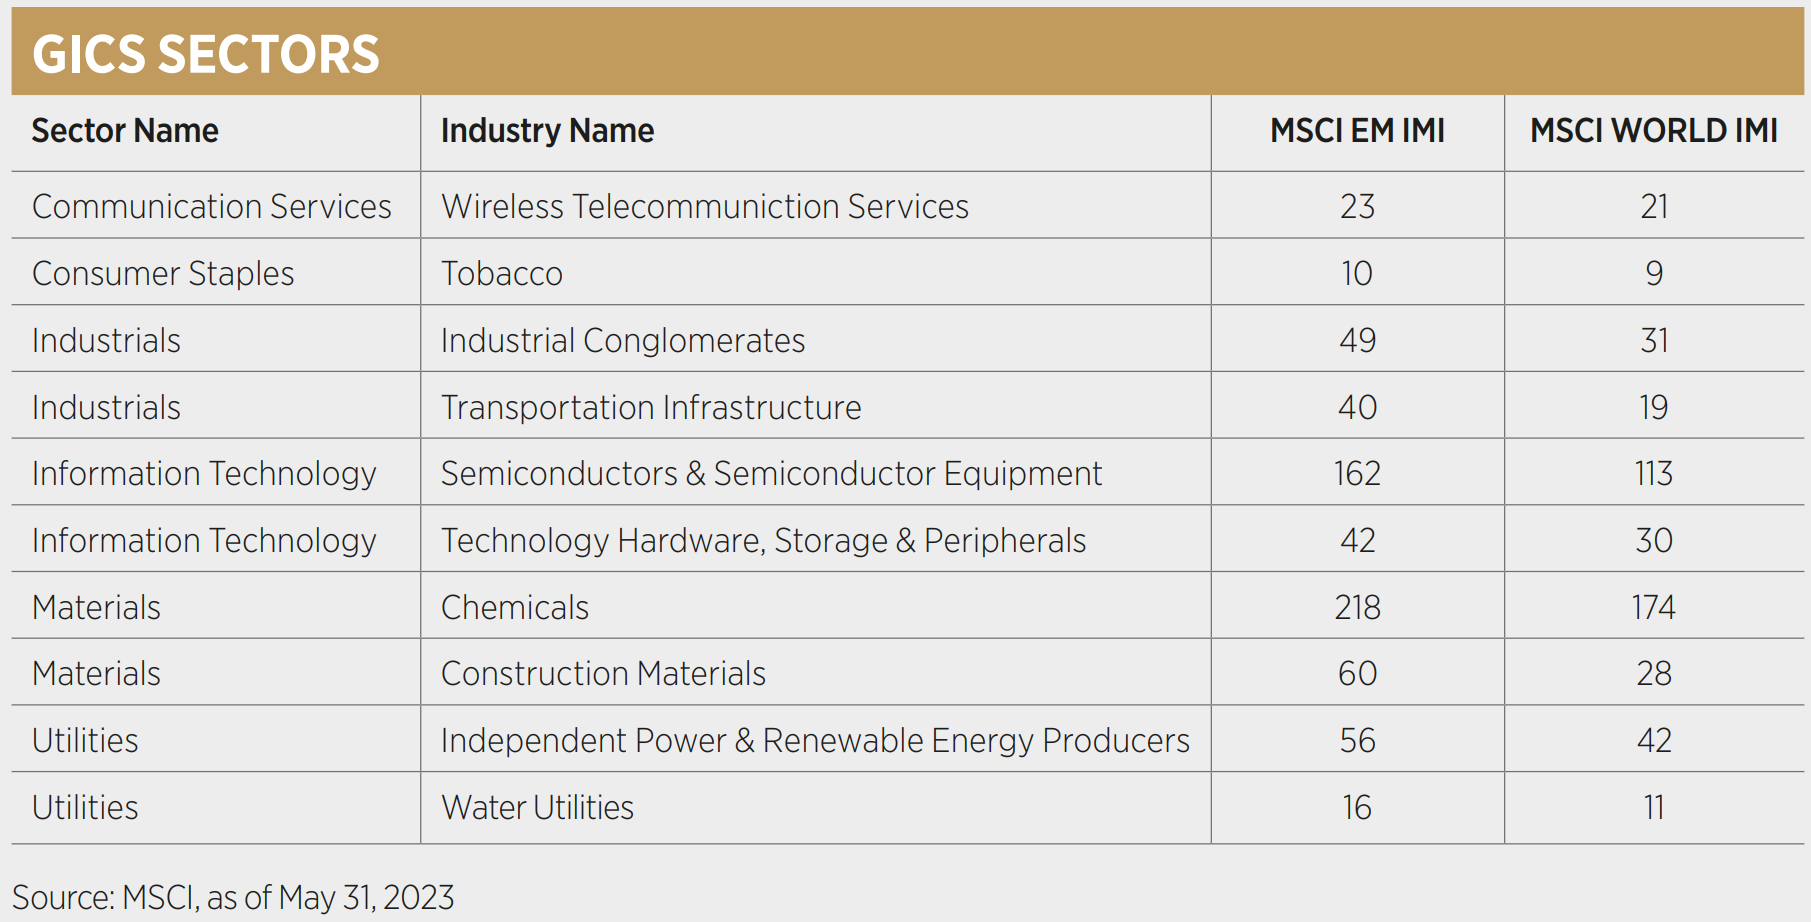
By comparing the MSCI World Investable Market index to the MSCI Emerging Markets Investable Market index, we can see, for example, that there are more listed companies in developed markets across the 11 GICS sectors, but as we dig deeper, we can see the EM opportunity set is larger for certain sub-industries.
At the sub-industry level within the GICS classification, we can see there are more diversified banks, semiconductor companies and electronic components companies in emerging than in developed markets.

A more favourable macro outlook
We can gain further insights into the EM landscape by looking at global GDP growth rates. According to the July IMF World Economic Outlook report, global growth is expected to slow to 3% in 2023 and 2024 from 3.5% in 2022. Growth projections, however, are not uniform across the globe, and emerging economies are expected to experience higher economic growth rates than advanced or developed economies.
The IMF expects rates to be higher, for example, in Asian emerging markets compared to other regions, projecting China to grow at 5.2% and India at 6.1%.
Attractive valuations
Through MSCI research,⁶ we have attempted to establish a relationship between relative valuations and subsequent performance. This relationship is particularly relevant for EM, which over time has surfaced at a significant discount compared to developed markets.
We found that, over the short-term, lower valuations were not associated with higher short-term performance. Over the longer-term, however, cheaper names tended to outperform more expensive ones.
An ageing population
According to the UN, the world population hit eight billion in November 2022 and is expected to grow to 9.7 billion in 2050 – growth expected to come mostly from Asian and African emerging and developing economies. The world population is expected to be older on average, but ageing is expected to be felt more in developed economies, where almost a third of the population will be over 65.
While the working-age population is expected to decrease in developed countries, most developing regions are expected to remain stable, and some might even see this population grow.
This “demographic dividend” may provide an opportunity for accelerated economic growth and social development.
MSCI’s defining EM role
At MSCI, our EM indices are built to help broaden the investment universe and expand opportunity sets. And as the architect of the market classification framework that has helped define EM as an asset class, we continue to play a pivotal role in its development.
In 1988, MSCI launched the MSCI Emerging Markets index – one of the first investable benchmark index global equity markets in the space.
At its inception, the index included 10 markets and comprised less than 1% of the global equity universe. Today, it encompasses 24 markets and accounts for nearly 11% of the global equity opportunity set. We now have over $1.3trn assets under management benchmarked to our EM indices.⁷
The space has changed dramatically since that time. We have continued fine-tuning our methodologies and developing advanced capabilities in EM, evolving to respond to rapid deglobalisation, significant Asia-Pacific economic growth, and new demand for frontier market exposure with, for example, the creation of a Baltic States index.
1 As of June 30, 2023 2 As of June 30, 2023 3 MSCI World IMI number of constituents as of May 31, 2023 4 MSCI EM IMI number of constituents as of May 31, 2023 5 Global Industry Classification System, GICS, is a four-tiered global industry classification standard jointly developed by MSCI and S&P Global Market Intelligence to provide investors with consistent and exhaustive industry definitions. The four tiers are: Sectors, Industry Groups, Industries and Sub-Industries. 6 “The Future of Emerging Markets”, April 2019 7 Source: MSCI, as of Dec. 31, 2022.
This article first appeared in ETF Insider, ETF Stream's monthly ETF magazine for professional investors in Europe. To access the full magazine, click here.


