When I was growing up, one of my favourite TV shows was The X-Files, which followed FBI Special Agents Fox Mulder (David Duchovny) and Dana Scully (Gillian Anderson) exploring paranormal events. For our younger readers, it was about aliens that had infiltrated human civilisation, especially the military and security complex of the US government.
Almost every episode ended with the tagline “The Truth Is Out There”. Today, I am spending a considerable amount of time conducting quantitative research and finishing my days thinking the same, “the truth is out there”, somewhere.
Unfortunately, investing is as much an art as it is a science. For example, today there is no standard definition for cheap stocks when pursuing factor investing. For some investors, it will simply be the price-to-book ratio of stocks while others combine several metrics. Which one is right?
It is interesting to note that a significant amount of the foundational literature of factor investing is based on data provided by Professor Kenneth R. French, which is freely available on his website. Almost every research article, including many of our own, and marketing pitches in this space feature his data. The factor returns have been replicated by other researchers, which highlights a robust methodology. It can be considered almost like the truth on factor investing, and we are very grateful for it.
But even this truth has several shades to it, which we will explore in this research note.
The complexity of calculating factor returns
There are many nuances when calculating factor returns, where the primary considerations are transaction costs, the universe of stocks and the portfolio construction.
First, transaction costs are usually ignored in academic research, which represents a significant issue, as many strategies lose their profitability when commissions, cost of financing and market impact costs are included.
Second, the definition of the universe matters immensely for achieving realistic returns. All stocks should be included, especially the ones that were delisted, as otherwise the analysis is subject to survivorship bias. It might also make sense to impose a minimum market capitalisation to avoid including illiquid stocks, as these are more expensive to trade.
Investors who use the data from Professor French should be aware that this data excludes transaction costs and includes micro and small-cap stocks, which results in the returns being overstated.
Return expectations should be lowered when viewing the historical performance of a factor like value or momentum.
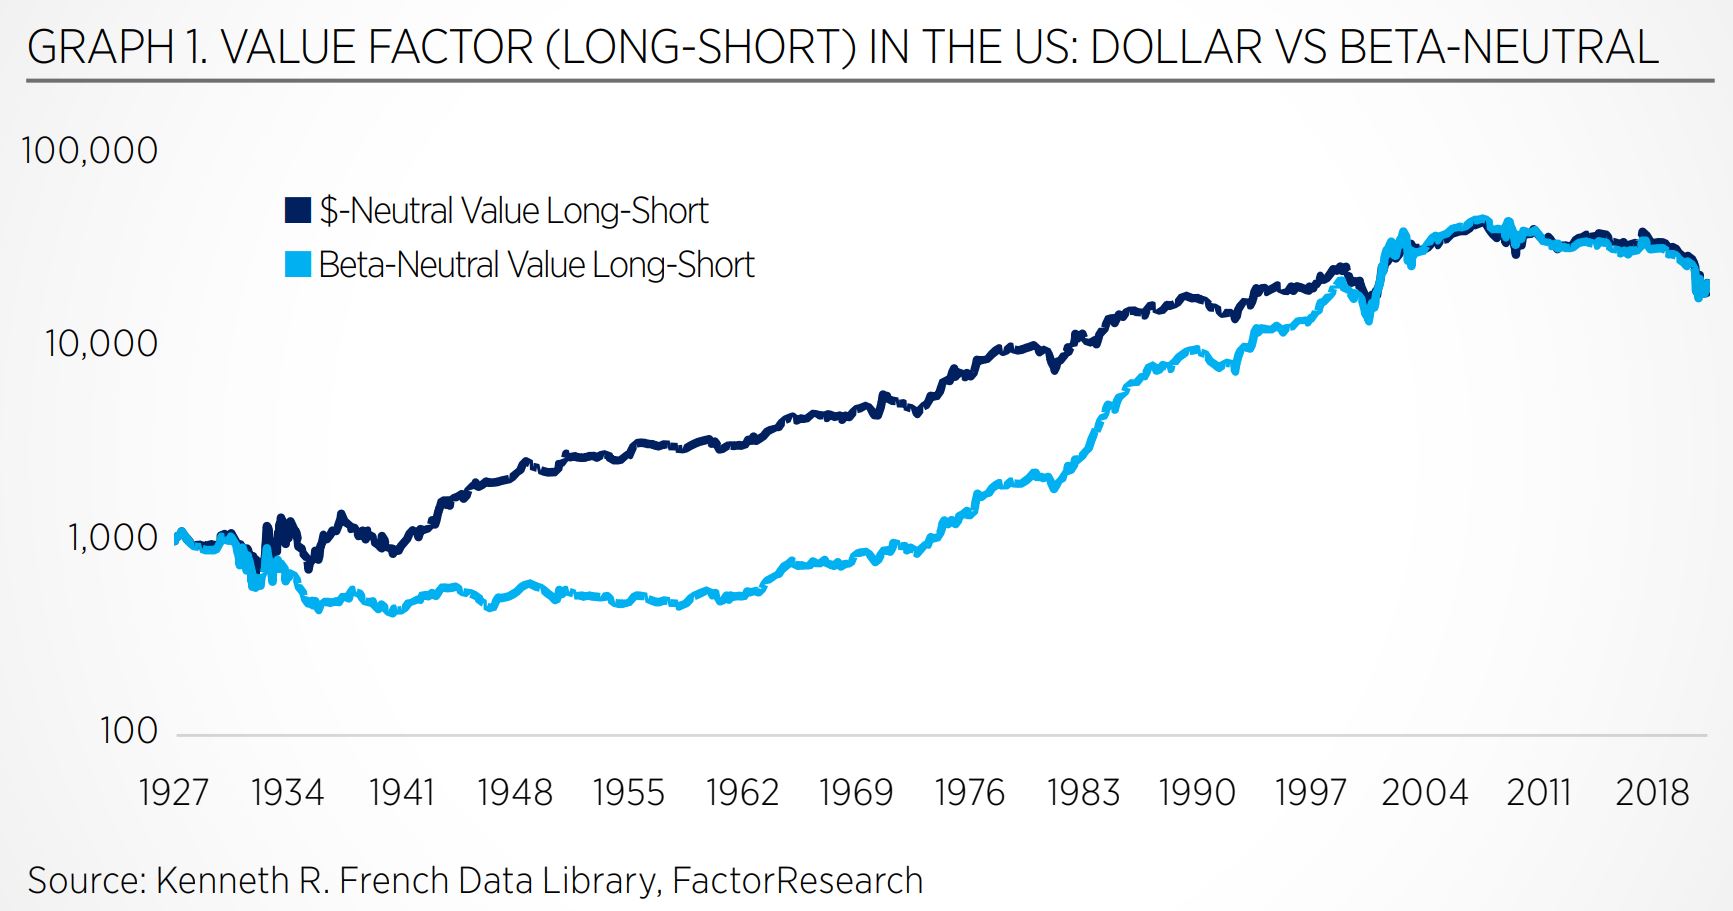
Finally, portfolio construction is a complex topic with many nuances. It comprises the stock selection process, rebalancing frequency, weighting methodology and portfolio sizing. We can highlight how sensitive factor returns are to changes in portfolio design by creating two versions of the long-short value factor in the US stock market: one comprising a dollar-neutral portfolio, which is how the data is presented on Professor French’s website, and the other designed to be beta-neutral, which we calculated based on his data.
We observe that the total return over the period from 1927 to 2020 was almost identical, but there was a significant difference in performance for multiple decades (see Graph 1).

Source: FactorResearch
Investors might ask why the portfolio construction had such a large impact in this case.
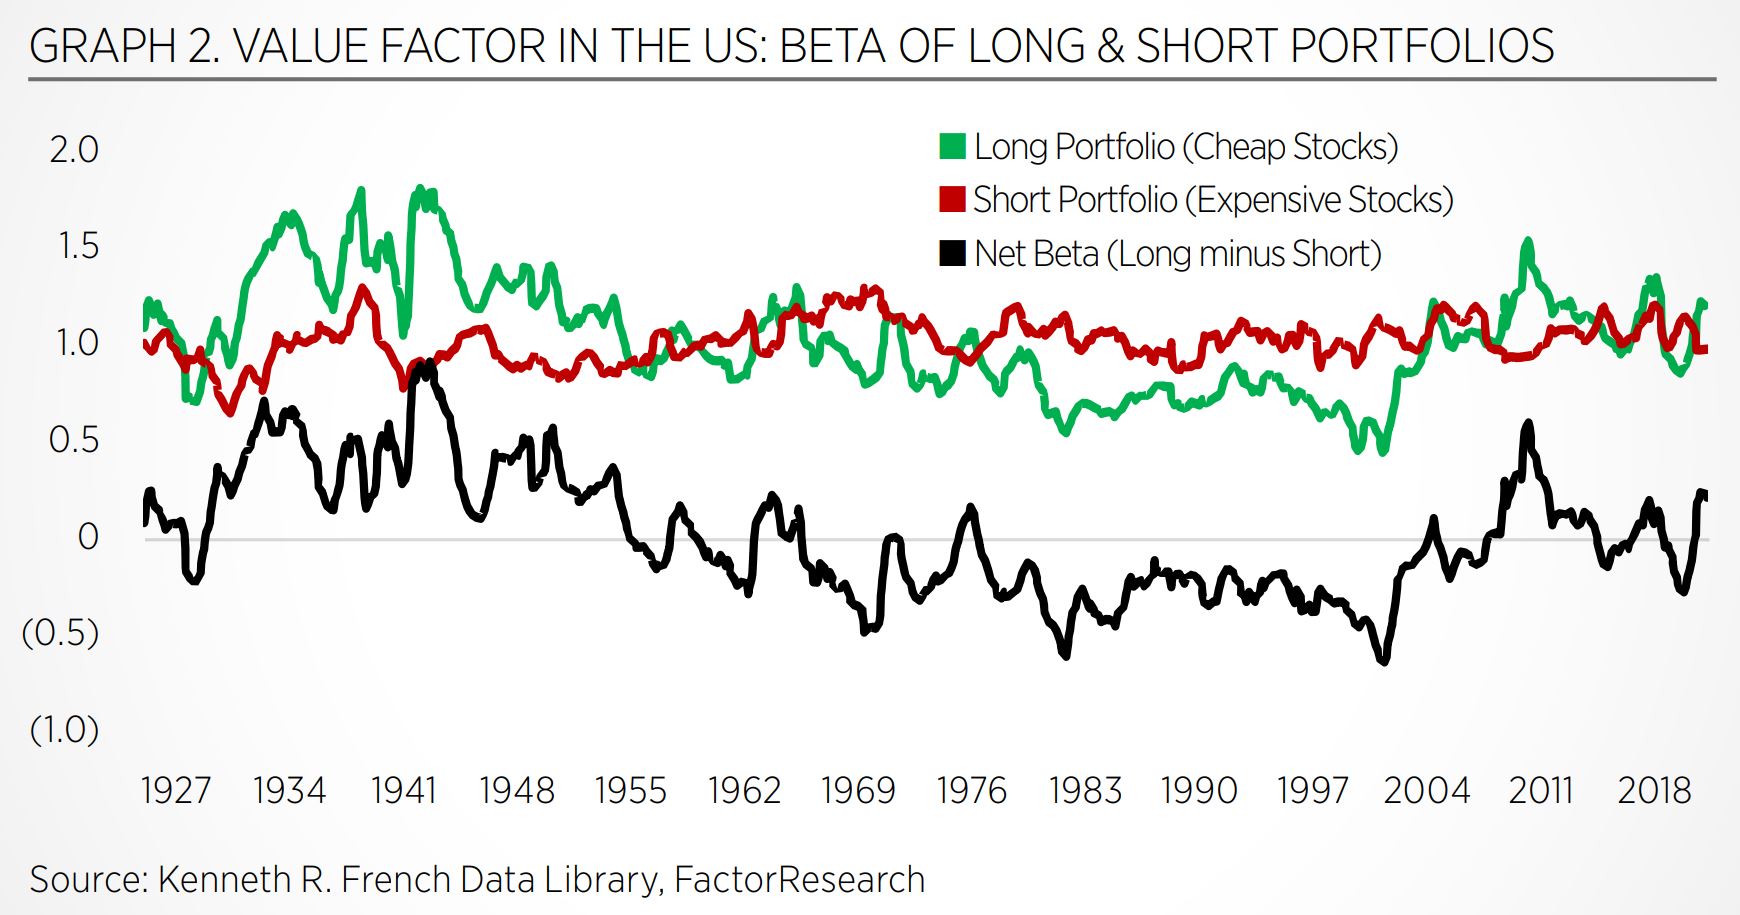
In both versions, the portfolios feature the same stocks, only the weights are different. In the period between 1932 and 1957, the cheapest stocks had significantly higher betas than the most expensive ones, which means the net beta was positive. Stated differently, the dollar-neutral portfolio had stock market exposure, and stocks were rising during that period (see Graph 2).

Source: FactorResearch
So, what was the true performance of the value factor in the US throughout this 90-year period? Should investors use US dollar- or beta-neutral returns? From an academic perspective, beta-neutrality is preferred, as these returns have zero exposure to the stock market.
However, the implication of that choice is that the performance of the value factor was significantly less attractive than in the minds of most investors.
Between 1932 and 1972, a 40-year period, buying cheap and shorting expensive stocks generated zero excess returns. And this excludes transaction costs. Would not this make value a rather unattractive and risky strategy?
More choices on portfolio construction
It is easy to demonstrate how other, seemingly minor changes can have a dramatic impact on returns.
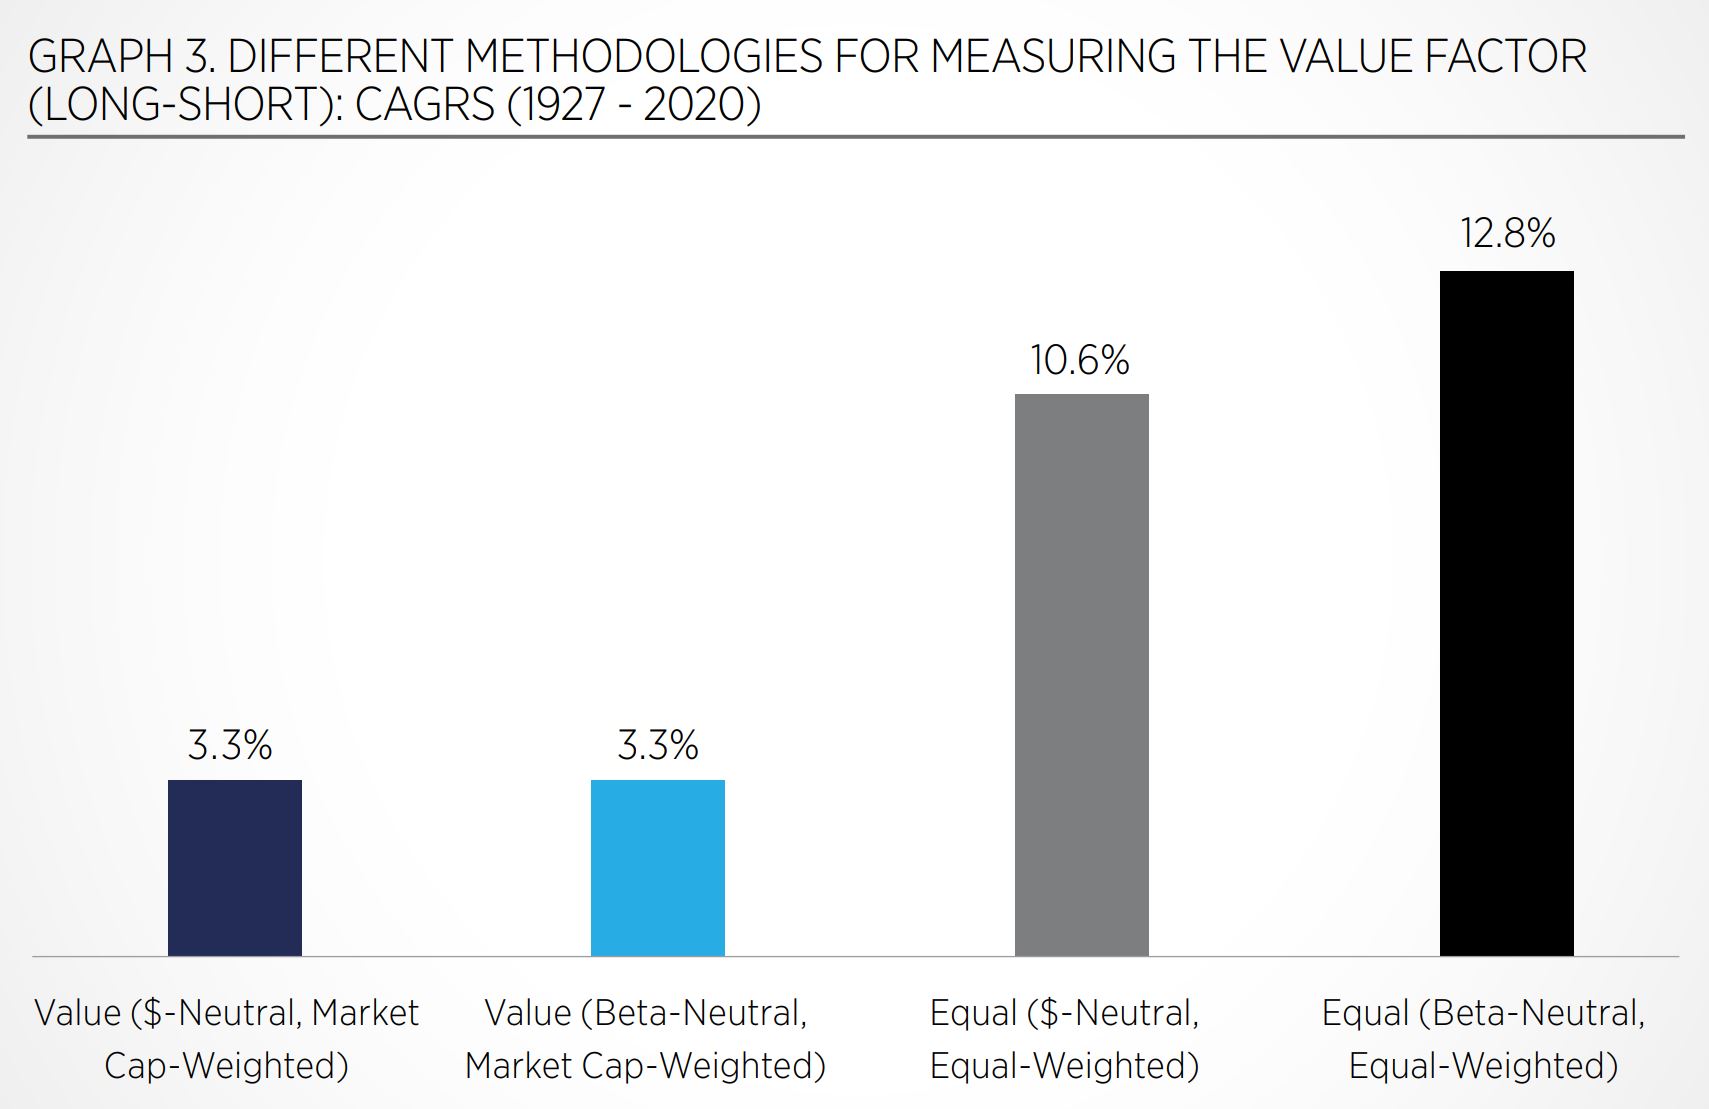
Most researchers select the market capitalisation-weighted returns of Professor French for their analysis. However, he also offers returns, based on equally weighted stocks, which is perhaps a purer representation of factor returns as it reduces the influence of the size factor.
We observe that equal-weighting stocks would have generated significantly higher returns than weighting them by market capitalisation. Which returns are more representative of true returns for factor investors? Should investors prefer equal-over market cap-weighting?
Theoretically yes, but practically this data set includes illiquid stocks which would make equal weighting almost impossible to implement.
Historically, market cap-weighted had an edge since long-only benchmarks like the S&P 500 are also using this approach (see Graph 3).

Source: FactorResearch
Implications of portfolio design
Having more options is usually better than having fewer options. However, in quantitative research, implementing varied methodologies leads to more data sets, which leads to different outcomes. This makes it challenging to decide on what is the truth, or the closest approximation to the truth. Ultimately, we want to reduce finance to simple binary relationships, as we are not good at coping with multiple variables simultaneously.
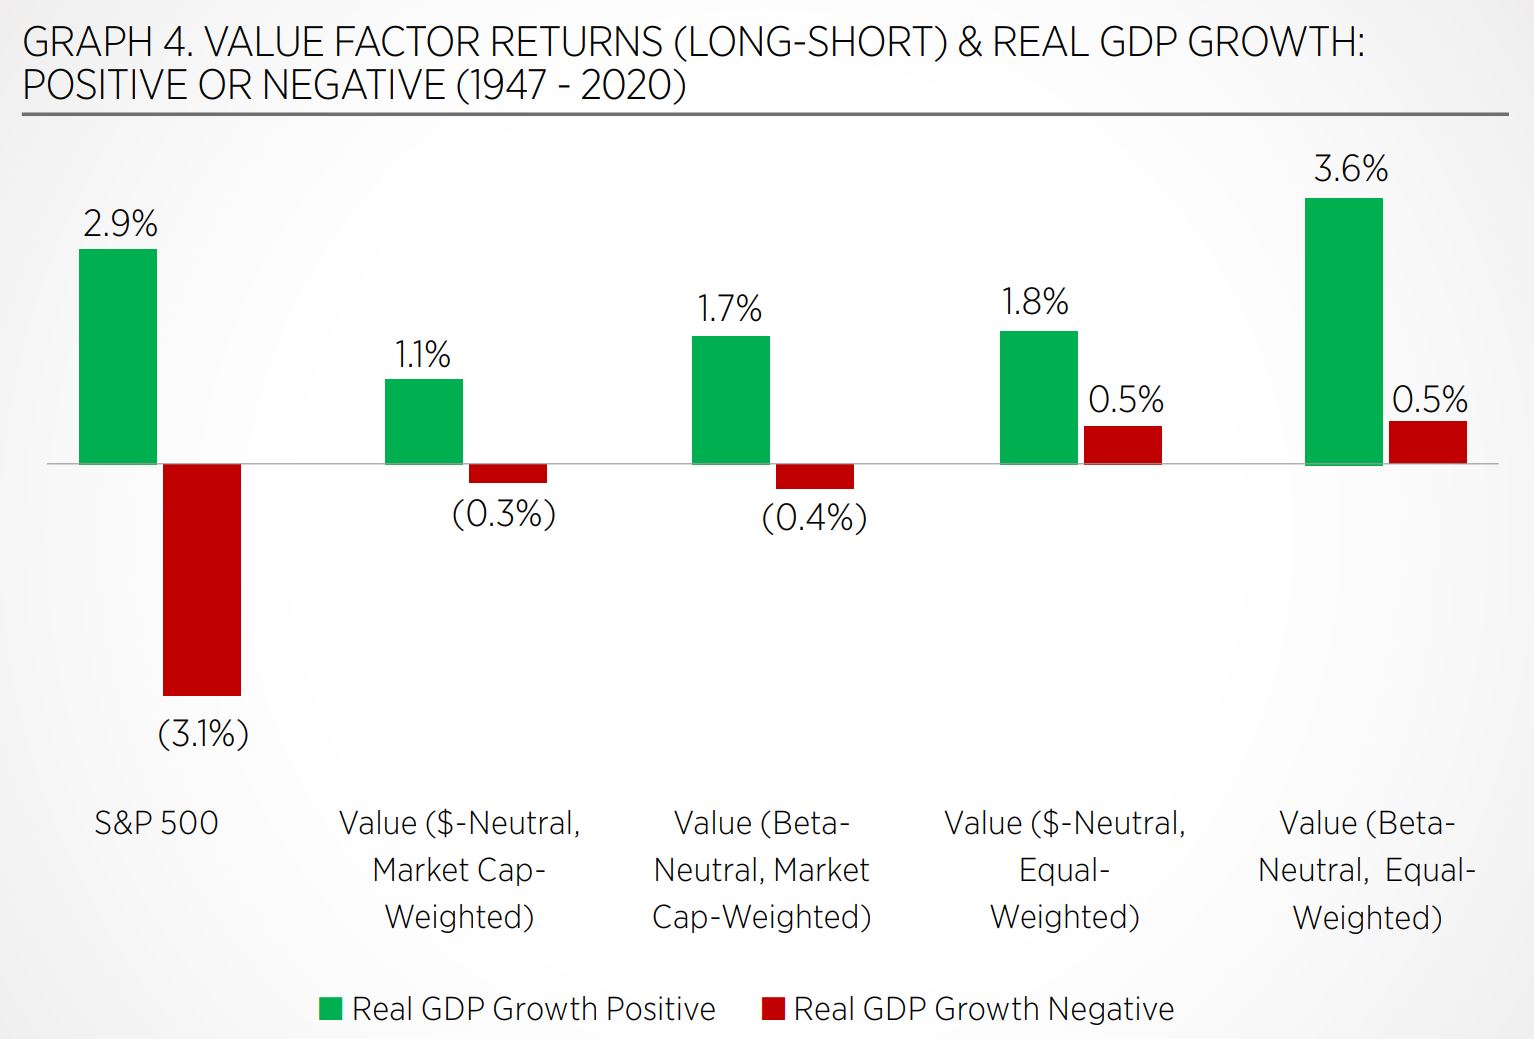
For example, we can evaluate the relationship between the long-short value factor and US real GDP growth, which highlights positive returns when the economy was growing, but negative when the growth was declining, thereby highlighting its pro-cyclical characteristics.
However, this largely again depends on the portfolio construction of the value factor. When using market cap-weighted returns, investors should be reducing their exposure when they expect the economy to decline (assuming this is possible). In contrast, when using equal-weighted returns, the value factor returns were low, but not negative, which is an important distinction (see Graph 4).

Source: FactorResearch
It is worth highlighting that we just discussed two aspects of portfolio construction. We have not simulated the impact of including transaction costs, removing illiquid stocks or changing the stock selection process. Each of these will have a significant impact on returns.
Some scenarios will make value investing far less attractive than commonly assumed, for instance, country, sector or industry neutrality, and the use of multiple value metrics.
Further thoughts
Most investors who subscribe to a factor investing philosophy base their decision on data they have seen or analysed themselves. After all, it represents an evidence-based approach to investing. So, which returns should be considered as the truth when considering factor investing? Unfortunately, there is no easy answer.
The truth, much like beauty, lies in the eyes of the beholder.
Nicolas Rabener is founder and CEO of FactorResearch
This article first appeared in the Q1 2021 edition of Beyond Beta, the world’s only factor investing publication. To receive a full copy,click here.


