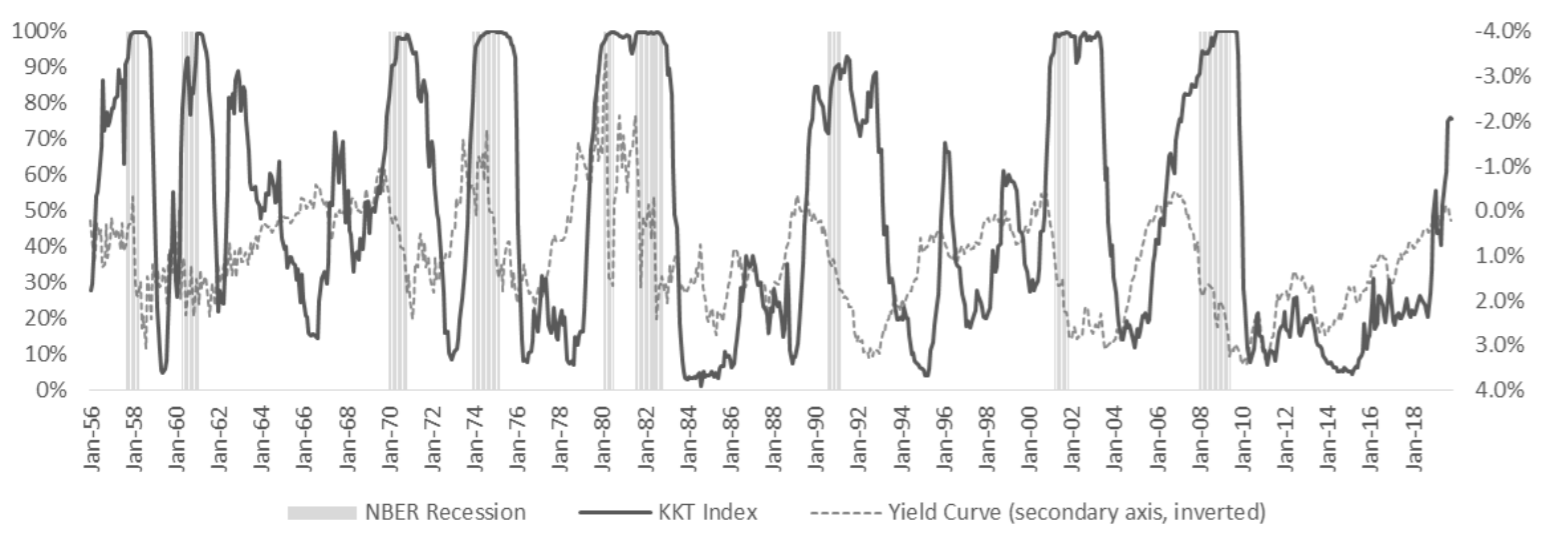
State Street teamed-up with academics from MIT earlier this year to create an index that measures the probability of an economic recession.
The KKT index, which measures the likelihood of robust growth on a scale of zero to one, forecasted in January that there was more than a 70% chance of a US recession in H1 leaving a 30% chance of growth over the same period.
A recession, defined by the NBER, is a period of falling economic activity spread across the economy, lasting more than a few months, normally visible in real GDP, real income, employment, industrial production, and wholesale-retail sales.
The KKT index differentiates itself from other economic indicators by accounting for statistical patterns of co-movement in variables, predicting whether a recession or a period of robust growth is likely to occur in the following six months.
It uses a testing method called the Mahalanobis distance which was originally used back in the early 1900s to compare skull sizes in India. Nowadays, it is used to measure financial turbulence by measuring the similarities of current economic variables to their values during past periods of recession and growth.
The study said this method of testing removes the risk of human bias by being purely data-driven which is sourced from 1956. It provides an objective assessment of the business cycle by being measured in statistical likelihood.
The economic variables that are included in the construction of KKT include: industrial production, nonfarm payrolls, return of the stock market and the slope of the yield curve.
Assessing the long-term impact of coronavirus
William Kinlaw and David Turkington, managing directors at State Street, and Mark Kritzman, a senior lecturer at MIT Sloan School of Management, tested the accuracy of the index in a study.
A performance back-test shows that when the index rose above levels of 50%, 60%, 70%, 80% and 90%, a recession subsequently occurred within the next six months with a similar proportion of the time: 54%. 61%, 70%, 77% and 91%, respectively.
In comparison, the yield curve alone was found to be a much less reliable indicator of a subsequent recession than the KKT index, especially for short horizons.

KKT Index and yield curve – Source: MIT
The table above shows the performance of the KKT index (left-hand axis) and the yield curve (right-hand axis) between 1956 and 2019. The shaded areas are periods of recession as defined by NBER.
The study argued the KKT index is a more accurate and objective method to forecast a recession than the NBER or the Conference Board’s indexes because it captures information about the co-movement of economic variables and removes the potential of human bias.
Sign up to ETF Stream’s weekly email here


