With some luck 2023 will be unlike the dire 2022 for investors. Last year, there were few places, apart from cash, to hide in. This year, although we suspect that the major sovereign bond markets will range sideways, several segments will perform strongly. In fact, the cycle looks a lot like 2001-02.
These years saw falling bond market volatility (aside from the 9/11 period) and large gains from corporate bonds. Overall, we expect real yields to fall, corporate high yield and investment grade bonds to deliver decent returns, fixed income yield curves to progressively steepen, bond volatility to drop and for the US dollar to lose more ground.
Two observations drive our thinking. First, the global liquidity cycle bottomed last October and is once again turning upwards, and, second, the general collateral shortage persists. This latter point likely explains why term premia across the major bond markets are so depressed, and, in cases, at or near their all-time lows.
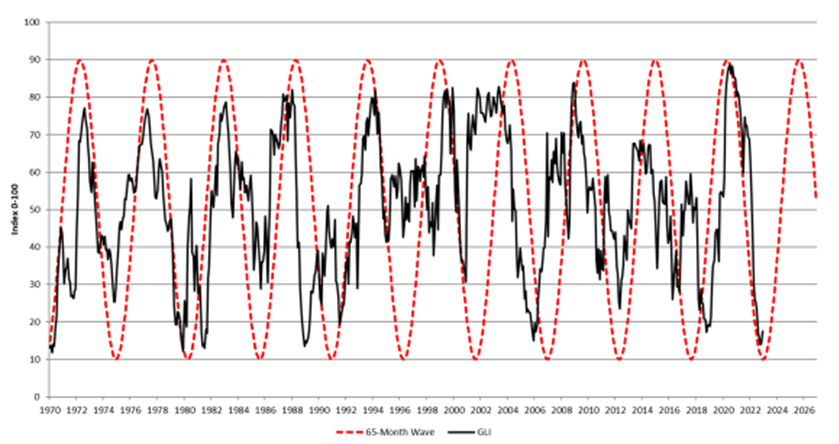
Chart 1 reports our Global Liquidity index. Liquidity, per se, measures of the flow of cash and credit moving through world financial markets. Put another way, it represents the ability to settle debts. Admittedly, the index currently remains low, but importantly it is beginning to inflect higher. What is more, as the sine wave overlaid on the chart suggests, assuming the uptrend continues, global liquidity is slated to rise through 2025. This may offer investors some welcome relief.
Chart 1: Global liquidity index (GLI) long-term cycles

Source: CrossBorder Capital
Behind the revival in global liquidity are clear signs that China’s People’s Bank (the PBoC) is injecting massive funds back into her money markets, rapidly reversing last year’s tight stance.
Through December and January, Chinese policymakers ploughed in close to $440bn of cash, or roughly a whopping 3½ times the sum they added over the previous 24 months.
On top, the UK gilt turmoil last September likely sufficiently spooked other international policy-makers that they too have begun inching liquidity back into their financial systems.
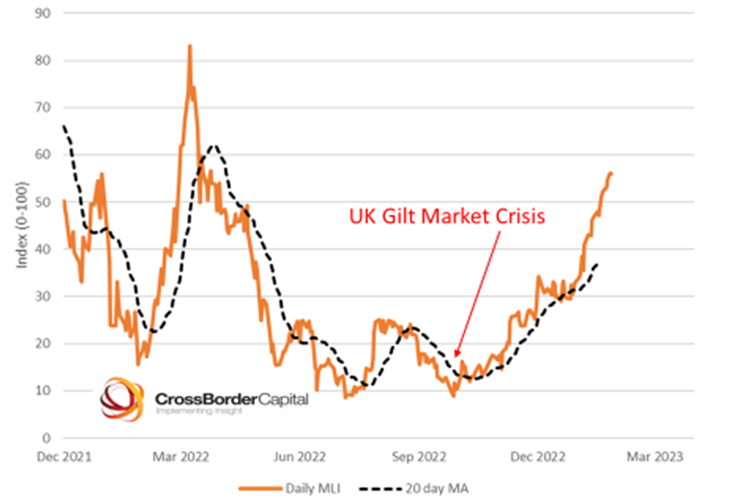
Chart 2: US Treasury market liquidity index (MLI)

Source: CrossBorder Capital
Evidence the US Fed, which despite paying homage to a ‘headline QT’ and continuing to let bonds roll off its balance sheet, is simultaneously adding sufficient liquidity to maintain US banks’ reserves above the critical $2.5-3trn threshold is deemed vital for financial stability. One result has been a jump in US Treasury market liquidity, based on measures of spreads and depth, and shown in the second chart. The low point of the index coincides with the UK’s gilt crisis.
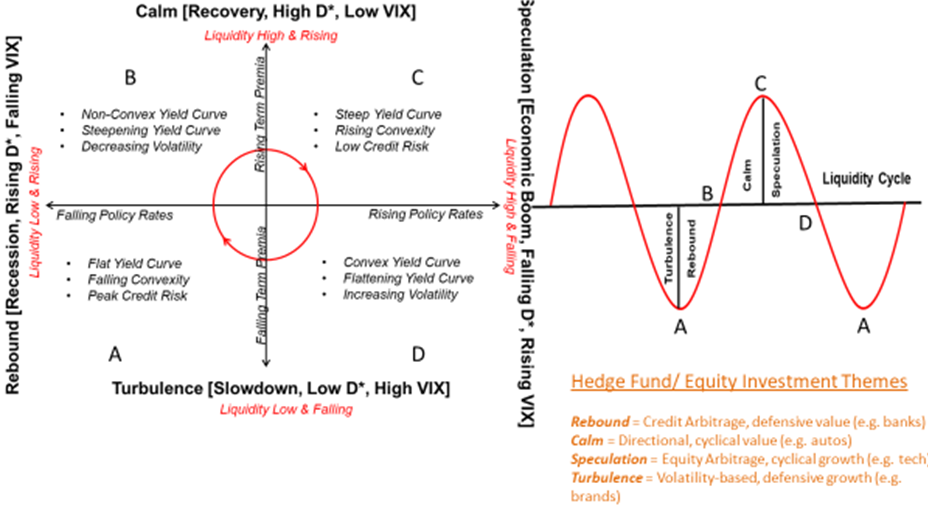
What does this all mean for markets and economies? Chart 3 describes our asset allocation framework. It is based on movements in the global liquidity cycle and specifically highlights four phases or investment regimes, namely calm, speculation, turbulence and rebound.
Chart 3: Stylised fixed income asset allocation: Where are we in cycle?

Source: CrossBorder Capital
These generic names convey something about the investment climate. Letters are drawn at the key inflection points in the cycle. Currently, markets are positioned around point B, or around the start of the rebound phase. The left-hand side of the schematic diagram indicates the broad features of bond market performance that investors should expect in each phase.
Stepping back to point B which occurred from late-2021, investors were likely to suffer a bearish flattening of yield curves and a sizeable step-up in bond market volatility. We need little reminding that this duly arrived! The journey from point D to A through late-2022 was likely to feature a flat to inverted yield curve, collapsing convexity (i.e. a much less humped curve) and signs of a peak in credit risk. Again, bond markets largely delivered on cue.
Looking forwards as we move towards point B, the next investment phase, namely rebound, should feature falling bond volatility and the beginnings of a steepening in the slope of the yield curve. Together, this cocktail is typically bullish for corporate bonds. However, it is unusual for government bonds to perform strongly during this phase of the global liquidity cycle, despite the widely hailed consensus view that urges us all to raise exposure to government debt.
This is not to say that government debt, after one of its worst years ever, will again generate negative returns in 2023. Rather we expect moderate positive gains. We are less upbeat than most for two reasons: first, not only does the real world economy look far more robust than economists have been projecting, but underlying concerns about a resurgence of inflation pressures will surely persuade central banks to keep policy interest rates higher for longer.
Second, consider a wonkish concern. Bond yields technically comprise two independent components – a rate expectations term and a bond term premium.
This term premium compensates investors for interest rate risk over the bond’s horizon. It is typically positive and rises with the maturity tenor of the bond, so that a 10-year bond embeds a larger term premium component than a one-year bond.
However, our latest estimates not only suggest that US (and European) bond term premia are negative, but they also stand at or close to all-time lows.
Therefore, investors in government debt face the prospect of sticky interest rate expectations and term premia that are more likely to rise and revert back to their ‘norms’.
Notwithstanding decent carry at the short-end of the term structure, this combination is not that appealing for investors in longer tenors. Consider that, although bond term premia may well have been driven lower by a structural shortage of collateral in repo and derivative markets, the odds of rising sovereign issuance (pace the temporary US debt ceiling impasse) and the declining appetite for US Treasuries from Chinese and Japanese buyers surely add to the risks of higher term premia?
Overall, referring back to the global liquidity cycle and its implications from Chart 3 we suggest five fixed income strategies: (1) US and European corporate bonds; (2) emerging market debt (especially given US dollar weakness and Chinese stimulus); (3) falling volatility capture; (4) yield ‘carry’ at the front-end of curves and (5) yield curve steepeners.
Michael Howell is managing director at CrossBorder Capital
This article was first published in Fixed Income Unlocked: After The Storm, an ETF Stream report


