In EMEA for Professional Clients (MiFID Directive 2014/65/EU Annex II) only. In Switzerland for Qualified Investors (Art. 10 Para. 3 of the Swiss Federal Collective Investment Schemes Act (CISA)). In Australia: for Wholesale Investors only
Finance has been identified as one of the core themes for COP28 in Dubai later this year. Undeniably, companies and investors have yet to find a panacea for all climate finance woes. Amid efforts to divest from harmful activities and use of equity ownership to incentivise change in public companies, green bonds may be the most direct lever for investors to contribute to the climate transition, especially in hard-to-abate sectors. Not only do green bonds provide much-needed financing, but the ring-fenced nature of the proceeds means that investors can provide a direct stimulus for green investment.
The green bond market has been in a period of steady growth in recent years, with new issuance peaking at over $550bn in 2021. Issuance fell for the first time in a decade when the Russian invasion of Ukraine drove up energy prices and inflation, resulting in interest rate hikes which dampened overall global issuance. This year, however, we may see a reversal, as figures from the Climate Bonds Initiative (CBI) show that green issuance in the first half of 2023 was nearly $280m, or 58% of the total volume in 2022.
As the market grows and the issuer base diversifies, some trends remain – financial companies continue to be the largest issuers, accounting for 29% of volume in the first half of 2023, and the euro remains the currency of choice not only for green bonds but for the broader sustainable debt category. This also translates to the issuer base.
The only two non-European issuers among the top 10 in H1 were Bank of China and Saudi Arabia’s Public Investment Fund1.
In terms of the type of projects funded by green bonds, the CBI reports that energy, buildings and transport-related project continue to receive the lion’s share of proceeds, however their overall share is falling. This is a clear indication that while these areas are home to some of the most carbon-intensive activities and hence have the greatest contribution potential to climate goals, there is an increased awareness for the need of funding for fields such as water, waste or land use.

Given the nexus between biodiversity, oceans and the climate, it is encouraging to see increased funding. Continuing the good news, Bloomberg reports that green bond deals have overtaken fossil-fuel deals for the first time ever in terms of debt capital raised.
For some investors, this roaring comeback of the green bond market in 2023 may have come as a surprise, given that one of the key incentive mechanisms that drove the market’s growth has run out of steam. For years, the existence of a so-called ‘greenium’ allowed issuers to price their new green issues tighter than their issuer curves would suggest2.
Undoubtedly an attractive tool for reducing funding costs, that would be even more powerful at a time when refinancing costs are starting to weigh on corporate profitability.
For now, our evidence suggests that there is no longer a market-wide ‘greenium’. Comparing issuer- and duration-matched green and non-green bonds, we observe low single basis point spreads3, a significant reduction from the levels quoted in the early days of the green bond market4. However, as the supply and demand characteristics appear to be more balanced, it is not unreasonable to think that other ways of strengthening the green bond space may soon be on the agenda.
The introduction of a green quota on central bank balance sheets is just one of many ways in which institutions can tighten the screws on a market that, despite early successes, does not yet reflect the full potential of green bonds as a transition tool.
The advantage for investors is that it makes portfolio construction easier - green bonds have always carried the same credit risk as non-green bonds, but with their pricing more aligned, they become perfect substitutes. As a result, as the market continues to mature, green and traditional indices look increasingly aligned. While the more recently established market for green sovereign bonds is still a few years away from such convergence, as issuance is still ramping up, the process is fairly complete in the corporate bond market.
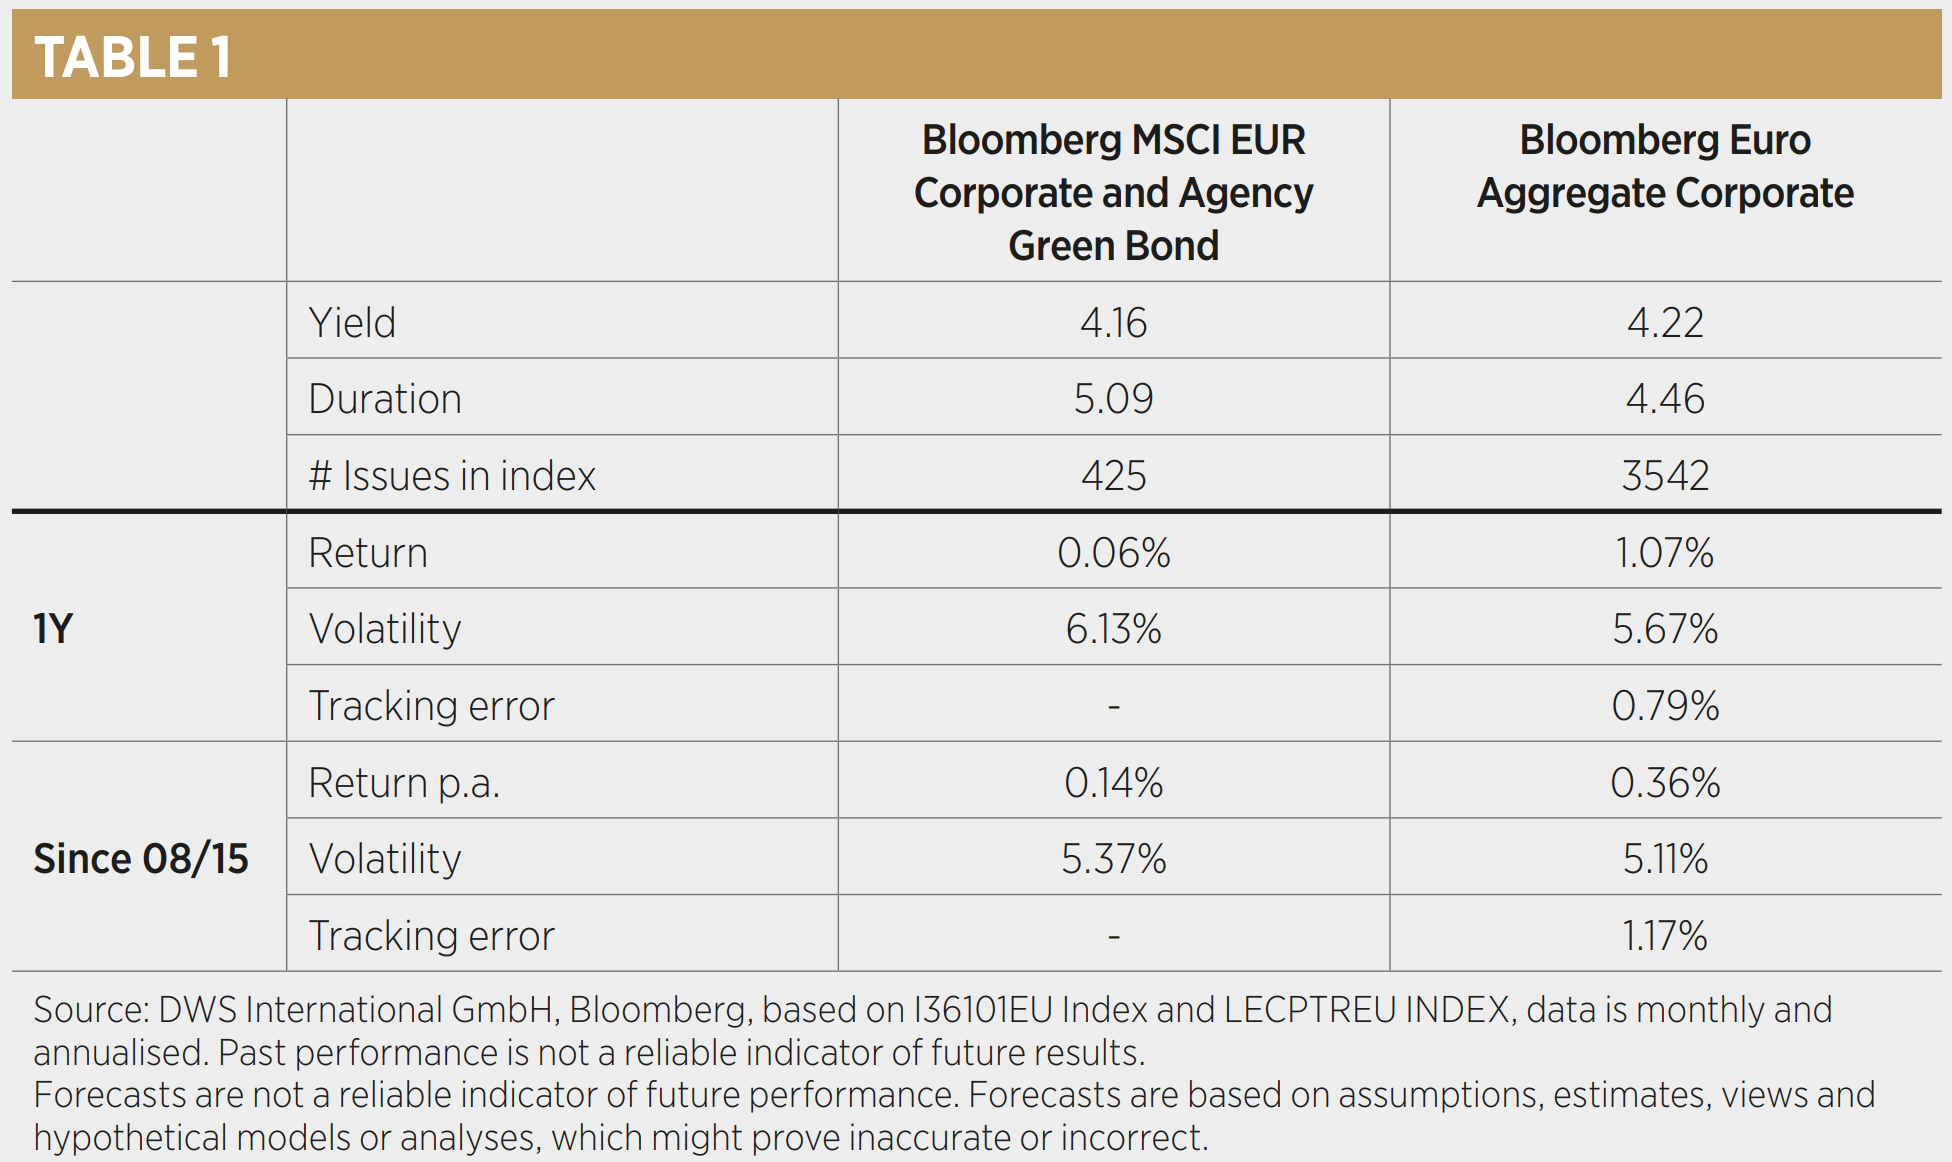
The Bloomberg MSCI EUR Corporate and Agency Green Bond index, which now includes over 400 different green bonds, offered a yield of 4.16% as at 31/08/2023, compared with 4.22% for the Bloomberg EUR Aggregate Corporate Bond index, one of the most representative euro corporate bond benchmarks. The remaining spread differential is best explained by small differences in duration, which remains approximately 0.5 higher for green bonds, and variations in sector exposures.

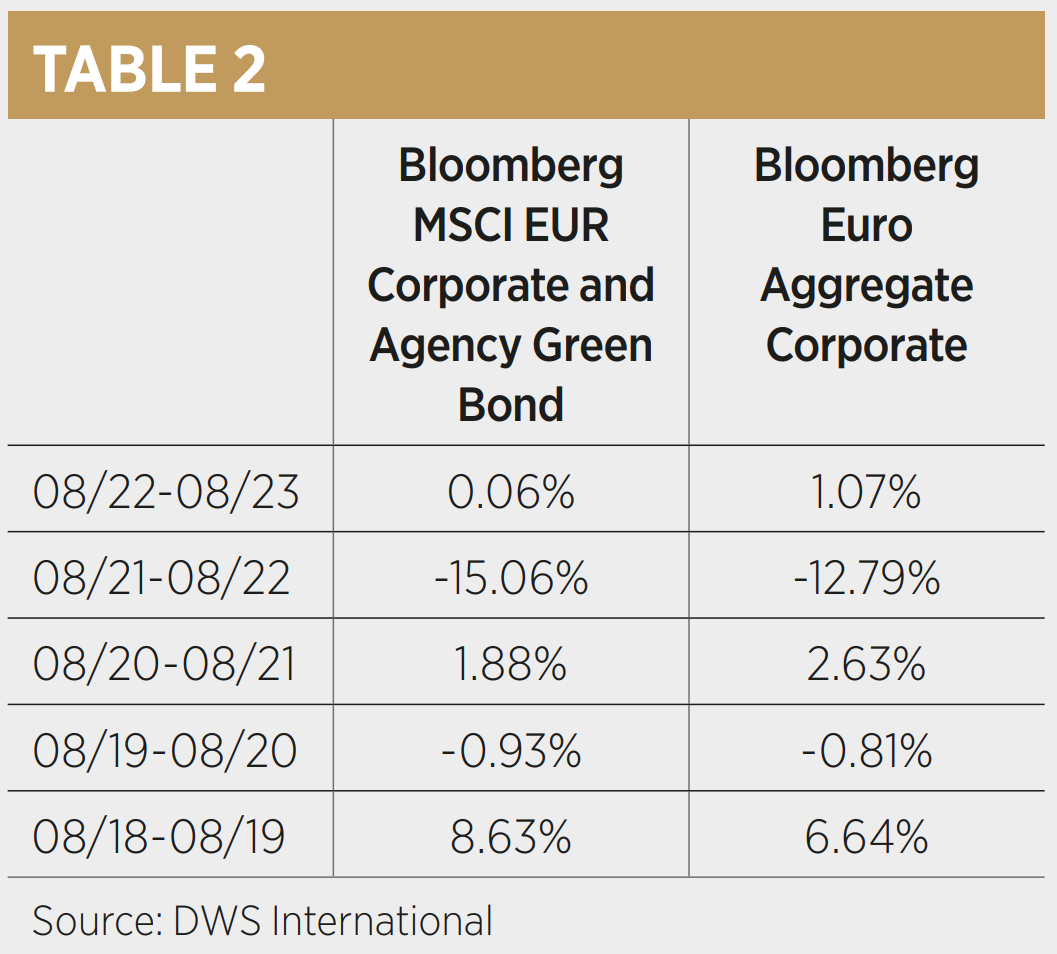
When examining past performance, these two factors need to be considered: Neither the longer duration nor the higher exposure to the utilities sector, which was particularly stressed in the early stages of Russia’s war with Ukraine, and the underexposure to the energy sector, which was one of the beneficiaries, helped performance.
Looking ahead, the corporate green bond space looks encouraging: not only has this year’s performance differential narrowed to eight basis points (bps), but the tracking error versus broad euro corporate indices has fallen below 100bps5. . This level tends to be a hurdle for many investors and could pave the way for a much larger allocation to ‘green’ fixed income. As income continues to return to the fixed income markets, this new dawn in green bonds is a welcome addition to the investor’s toolkit for gaining corporate bond exposure while making a measurable contribution to corporate green investments.
Lukas Ahnert is senior product specialist at Xtrackers by DWS
This article first appeared in ETF Insider, ETF Stream's monthly ETF magazine for professional investors in Europe. To access the full magazine, click here.
1 Based on Climate Bond Initiative “Sustainable Debt Market Summary H1 2023” report 2 The term greenium describes the idea that investors are willing to pay a premium to hold a green bond rather than a conventional bond, as they are willing to accept lower monetary returns in exchange for supporting environment-benefitting activities. 3 DWS International GmbH: analysis matches green bonds with non-green bonds of the same issuer while controlling for maturity, rank and average rating. Allowing for 0.5Y of maturity mismatch for corporate and 1Y of maturity mismatch for government bonds. 4 BIS: “Green bonds: the reserve management perspective”, September 2019 5 Bloomberg, calculations based on year to end August 2023.
Important information
DWS is the brand name of DWS Group GmbH & Co. KGaA and its subsidiaries under which they do business. The DWS legal entities offering products or services are specified in the relevant documentation. DWS, through DWS Group
GmbH & Co. KGaA, its affiliated companies and its officers and employees (collectively “DWS”) are communicating this document in good faith and on the following basis. This document is for information/discussion purposes only and does
not constitute an offer, recommendation or solicitation to conclude a transaction and should not be treated as investment advice. This document is intended to be a marketing communication, not a financial analysis. Accordingly, it may not
comply with legal obligations requiring the impartiality of financial analysis or prohibiting trading prior to the publication of a financial analysis. This document contains forward looking statements. Forward looking statements include, but are
not limited to assumptions, estimates, projections, opinions, models and hypothetical performance analysis. No representation or warranty is made by DWS as to the reasonableness or completeness of such forward looking statements. Past performance is no guarantee of future results. The information contained in this document is obtained from sources believed to be reliable. DWS does not guarantee the accuracy, completeness or fairness of such information. All third party
data is copyrighted by and proprietary to the provider. DWS has no obligation to update, modify or amend this document or to otherwise notify the recipient in the event that any matter stated herein, or any opinion, projection, forecast or
estimate set forth herein, changes or subsequently becomes inaccurate. Investments are subject to various risks. Detailed information on risks is contained in the relevant offering documents. No liability for any error or omission is accepted
by DWS. Opinions and estimates may be changed without notice and involve a number of assumptions which may not prove valid. DWS does not give taxation or legal advice.
This document may not be reproduced or circulated without DWS’s written authority. This document is not directed to, or intended for distribution to or use by, any person or entity who is a citizen or resident of or located in any locality, state,
country or other jurisdiction, including the United States, where such distribution, publication, availability or use would be contrary to law or regulation or which would subject DWS to any registration or licensing requirement within such
jurisdiction not currently met within such jurisdiction. Persons into whose possession this document may come are required to inform themselves of, and to observe, such restrictions
In Hong Kong, this document is issued by DWS Investments Hong Kong Limited. The content of this document has not been reviewed by the Securities and Futures Commission.
© 2023 DWS Investments Hong Kong Limited
In Singapore, this document is issued by DWS Investments Singapore Limited. The content of this document has not been reviewed by the Monetary Authority of Singapore.
© 2023 DWS Investments Singapore Limited
In Australia, this document is issued by DWS Investments Australia Limited (ABN: 52 074 599 401) (AFSL 499640). The content of this document has not been reviewed by the Australian Securities and Investments Commission.
© 2023 DWS Investments Australia Limited.
© 2023 DWS International GmbH.
As of 18/09/2023
CRC: 097673


