In EMEA for Professional Clients (MiFID Directive 2014/65/EU Annex II) only. In Switzerland for Qualified Investors (Art. 10 Para. 3 of the Swiss Federal Collective Investment Schemes Act (CISA)
ETF flows have become a crucial barometer for detecting significant shifts in investor allocation trends. One trend that has not gone unnoticed is the momentum building behind India.
However, while globally India-focused ETF flows have turned positive for the fourth consecutive quarter in Q1 2024, many European investors remain underweight India¹.
In the coming months, market realities will shift further with the imminent inclusion of Indian government bonds in the JP Morgan GBI EM index. In light of these developments, investors may want to take a second look at India – one that goes beyond tracking error considerations alone.

The India story: A poorly kept secret
The macro investment case for India is becoming increasingly apparent. Once considered part of the “fragile five” a decade ago, India has now become a darling of emerging market (EM) investors.
India’s demographic advantages are well known and stem from a combination of the world’s second-largest labour force, with some 694 million people aged 20-55 (second only to China), and a relatively young population with a median age below 30².
A lasting “demographic dividend” may become a significant tailwind for what is already the world’s most populous country.
The government’s capex offensive, expanding exports and the bond market’s opening are now also generating momentum for stock markets. India’s focus on digitalisation has led to a rapidly expanding technology sector, driven by artificial intelligence and the India Stack initiative.
In combination with an energetic government driving reform and investment while increasingly integrating into global trade, this has led to particularly rapid growth in services exports. This is offsetting India’s trade deficit in goods and is giving the central bank and government more room to manoeuvre.
Together, these factors are putting India on track to be one of the fastest-growing economies in the world, with an estimated GDP growth of 6.5% in 2024, and to become the third-largest country by GDP by 2028³.
Changing market realities: China + 1
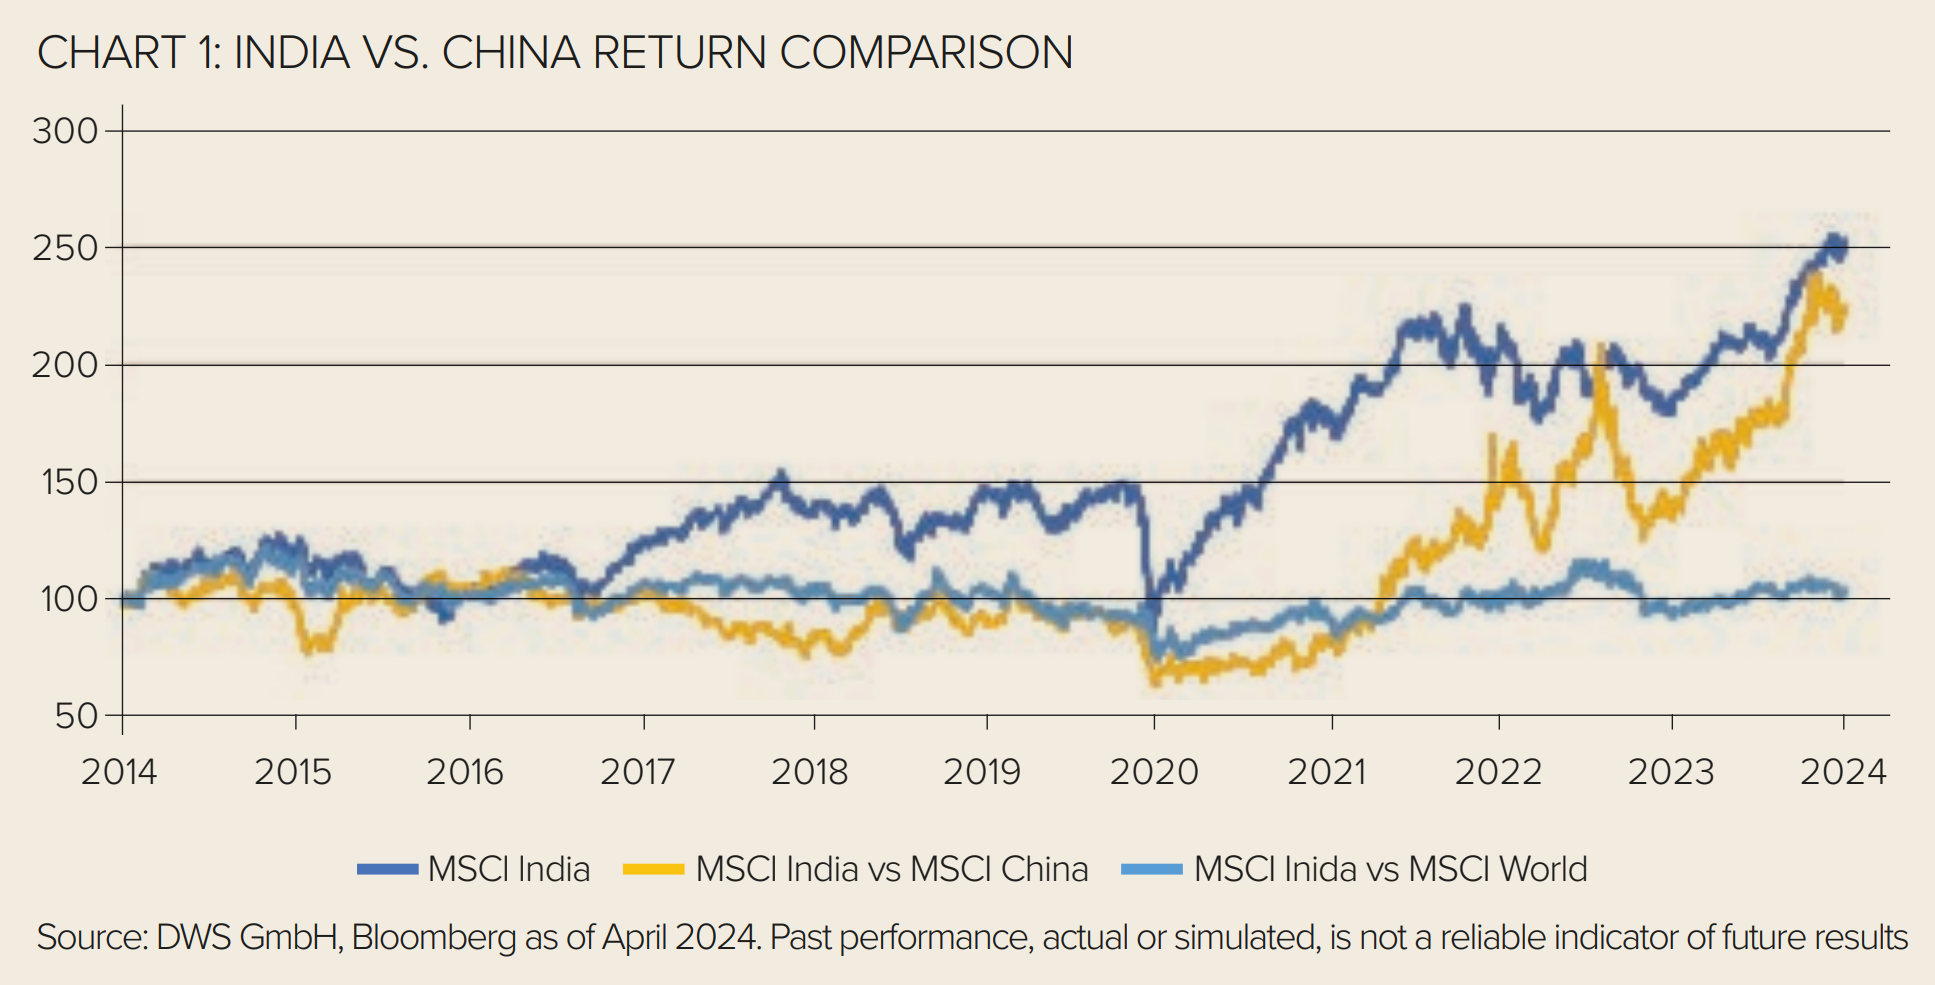
The rising economic outlook for India has seen robust association with equity market performance. Over the past three years, the MSCI India Index has gained over 40%, while the MSCI EM Index has lost close to 15% and MSCI China Index has lost more than 45%⁴.
This is already impacting allocation realities, as an EM benchmark investor will now find almost 20% of their allocation in India, only trailing China by about 7% and up from 6% in 2011⁵.
This is another powerful reminder that broad-based benchmark investing remains sufficiently flexible to adjust to changing long-term trends. More importantly, India is becoming the second country exposure after China that investors may want to manage on a stand-alone basis.
When it comes to implementation, investors benefit from a straightforward index landscape, with the Nifty 50 and MSCI India being broadly aligned and closely connected to domestic consumption.
Portfolio representation: A widening allocation gap
The evolving role of India in the fixed income landscape is also noteworthy. With a mere 1% foreign ownership⁶, the Indian bond market is significantly under-owned by international investors.
However, as of June 2024, market realities are shifting once again, with Indian Fully Accessible Route (FAR) government bonds set to join JP Morgan’s flagship local government bond indices. This inclusion will put India on the map for bond investors and, given the size of its beyond market, it is expected to reach the 10% index cap⁷.
The inclusions alone could translate to an estimated influx of foreign capital of over $20bn, a funding boost to India’s ambitious infrastructure upgrade. If the inclusion of China into fixed income benchmarks in 2019 and onwards, which attracted over $250bn in foreign portfolio investment, serves as any guide, this might just be the beginning⁸.
In the longer term, India could be included in the much larger Bloomberg Global Aggregate and FTSE World Government Bond indices, leading to even greater international investment. In 2024, many investors will be evaluating the role of India in their equity and fixed income portfolios.
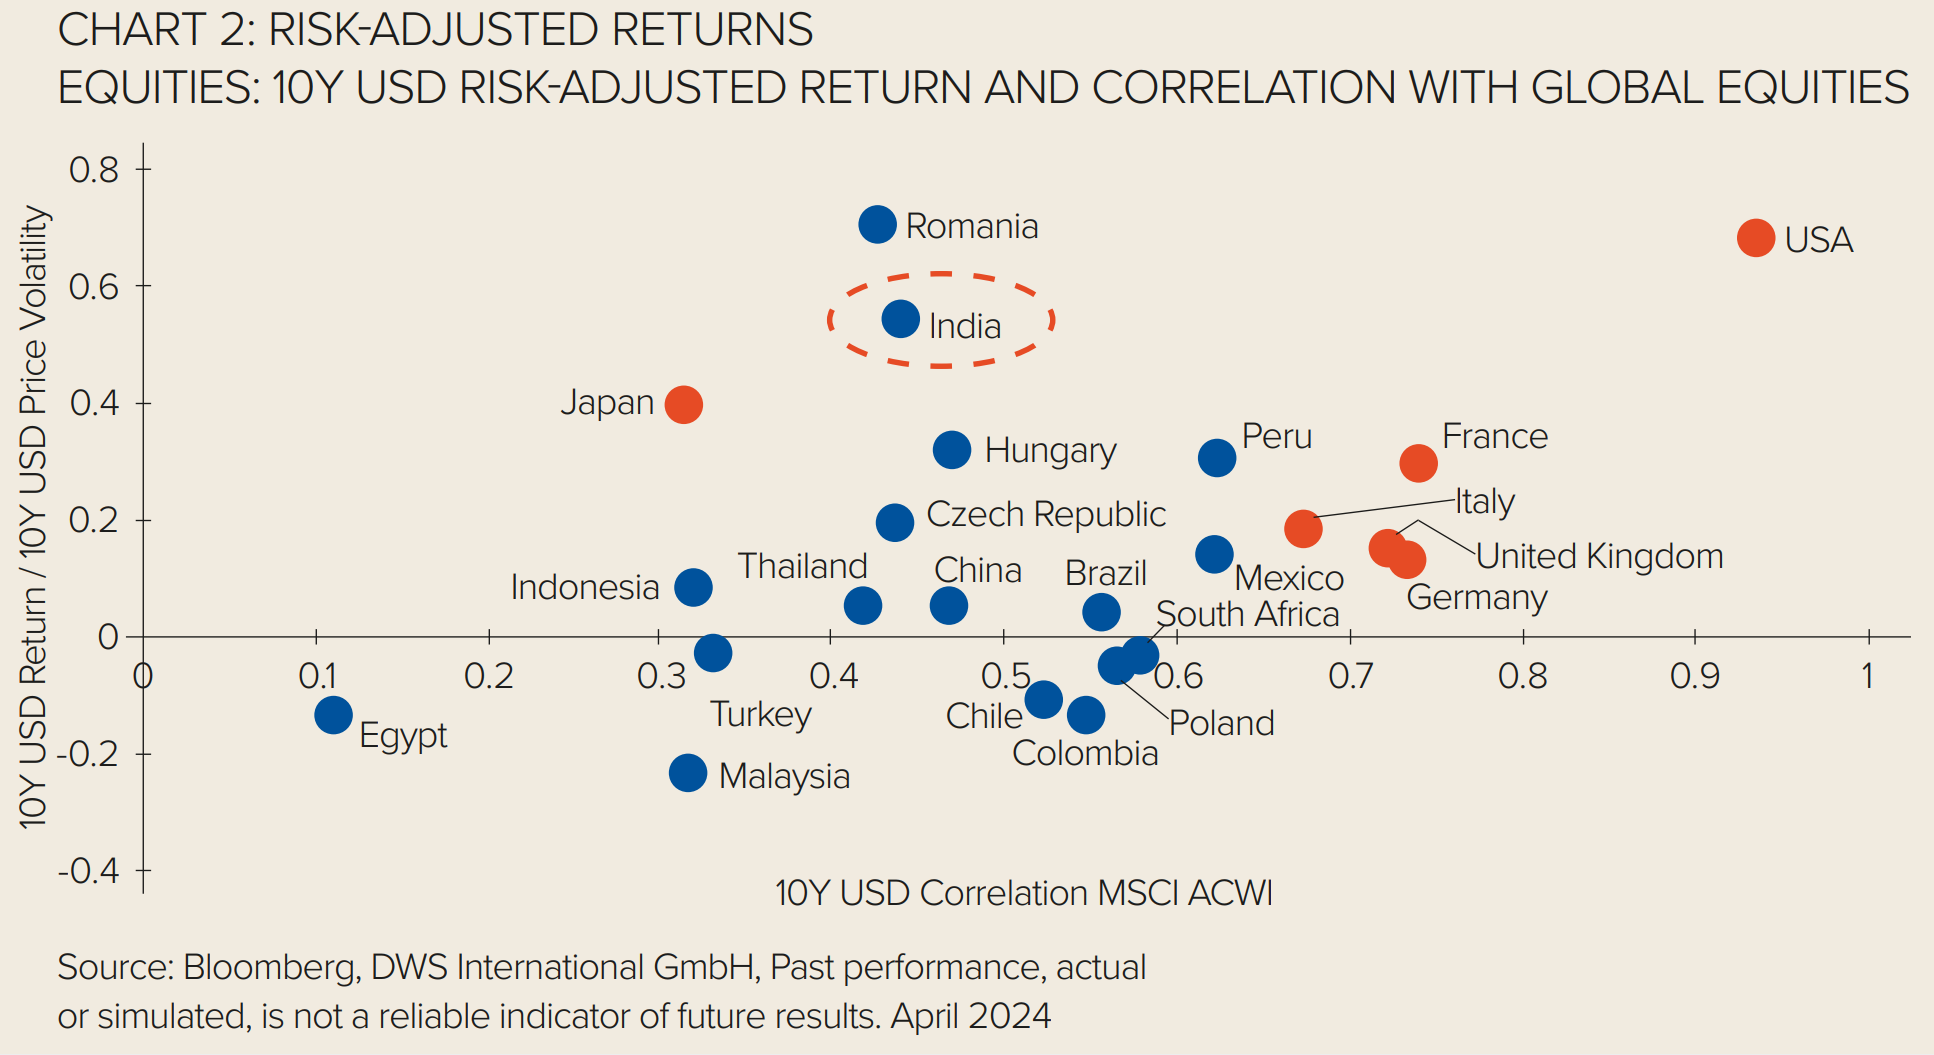
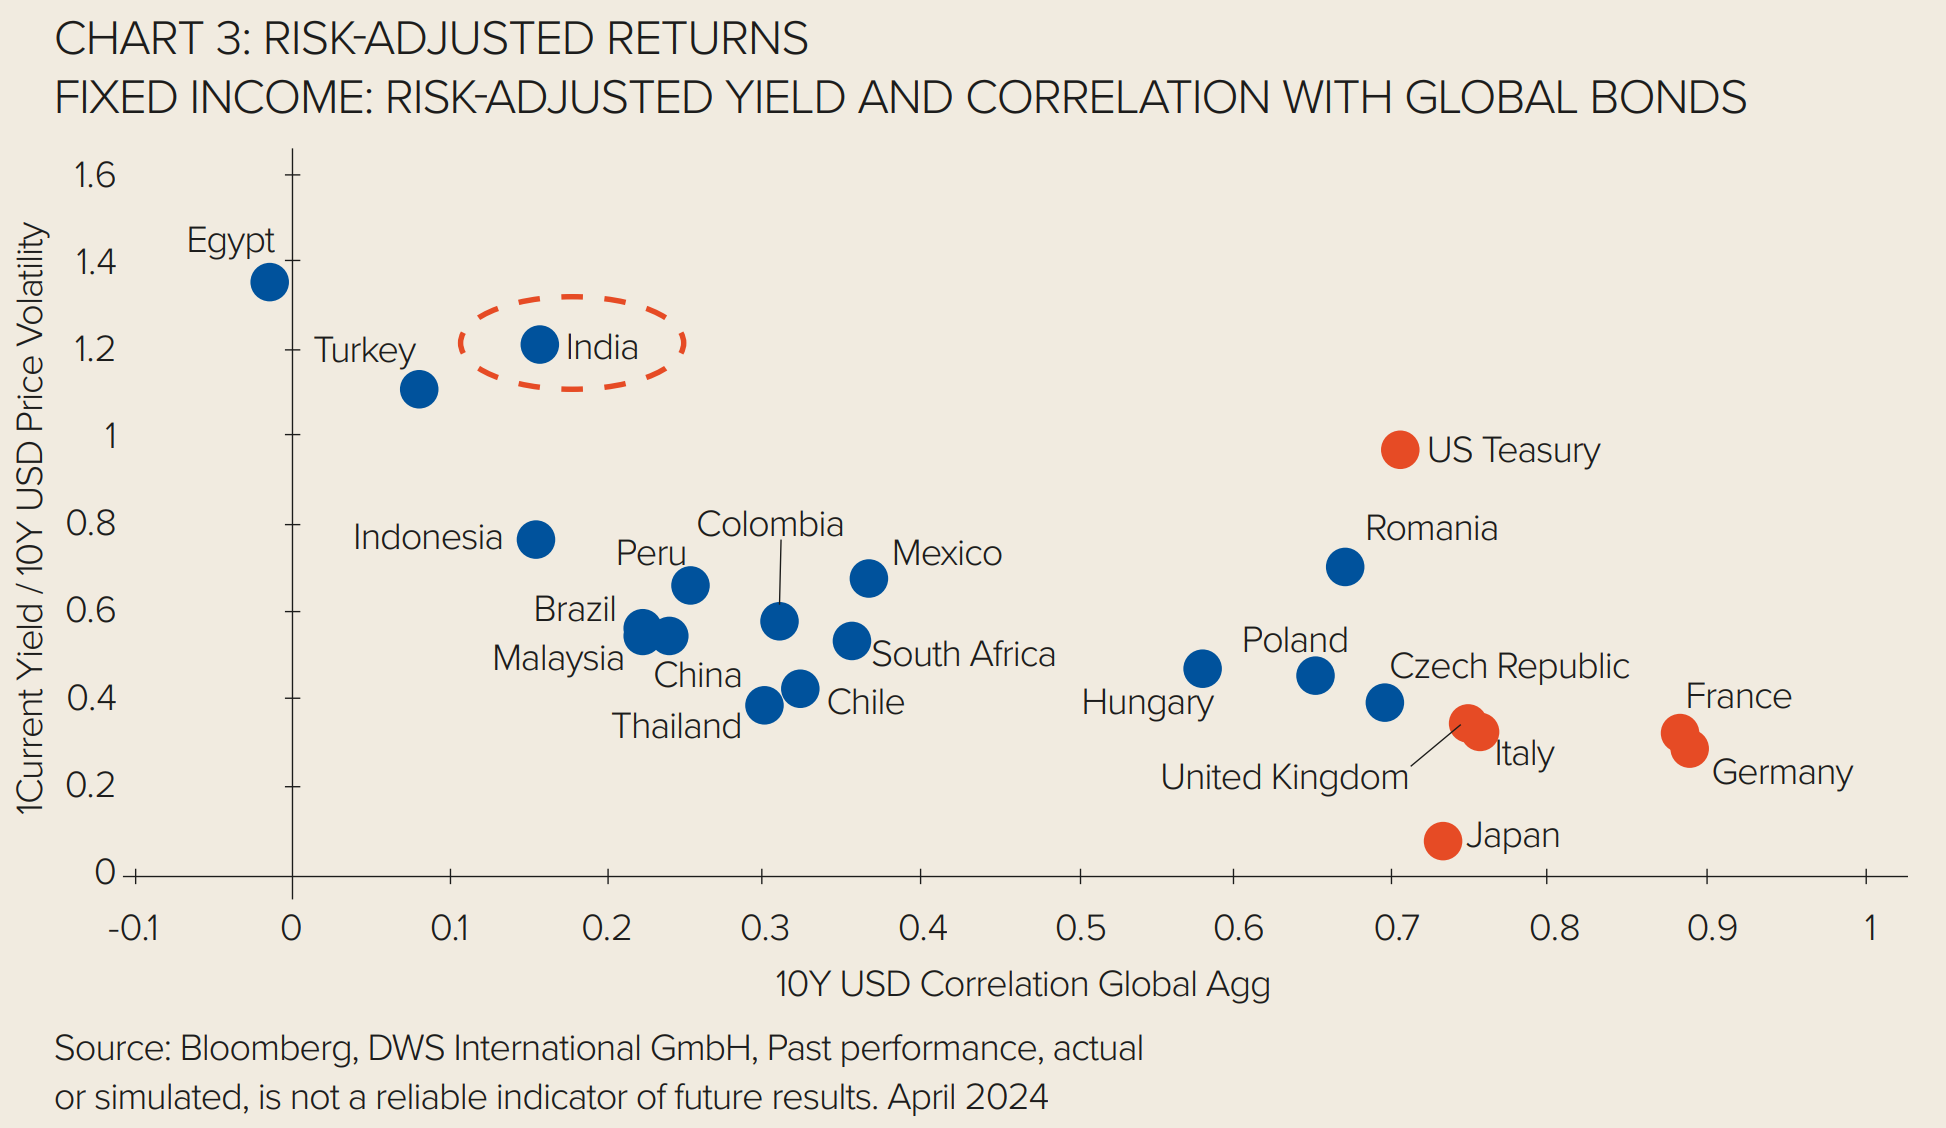
It is important to note that the rewards of including India extend beyond mere tracking risk mitigation. Historically, investors have been benefitted from a distinct risk-reward profile that mirrors India’s increasing independence.
As depicted in Figure 2, India can be viewed as both a source of returns and a means of diversification for equities and fixed income portfolios.

This is closely tied to the domestic growth narrative that investors are partaking in, distinguishing India from many EM peers with more significant ties to the global economy.
The prerequisites for the perpetuation of this trend may be already in place. In the equities market, expectations of double-digit earnings growth and a unique sector composition, featuring a rising yet non-dominant tech sector, render India a distinctive EM allocation option.
For fixed income investors, the potential benefits include a yield of over 7% on Indian government benchmark bonds⁹.

Provided that currency headwinds remain moderate and interest rate cycles continue to diverge from DM countries, India may serve as a robust diversification strategy considering rising DM sovereign allocations.
This article first appeared in ETF Insider, ETF Stream's monthly ETF magazine for professional investors in Europe. To read the full edition, click here.
1 Source: Bloomberg Intelligence as of April 2024
2 Source: DWS International GmbH, CEIC, RBI, Morgan Stanley Research, Morgan Stanley Research Estimates, Investindia.gov.in as of April 2024
3 Source: DWS International GmbH, IMF as of July 2023
4 Source: DWS International GmbH, Bloomberg as of 29th March 2024. Past performance, actual or simulated, is not a reliable indicator of future results. Based on USD Net Total Return performance
5 Source: DWS International GmbH, MSCI as of April 2024
6 Source: Reserve Bank of India as of April 2024
7 Source: DWS International GmbH, J.P. Morgan as of April 2024
8 Source: DWS International GmbH, J.P. Morgan estimates as of April 2024. China data is inclusive of all local currency bonds including CGBS, FBs and NCDs
9 Source: DWS International GmbH, Bloomberg as of April 2024
DWS is the brand name of DWS Group GmbH & Co. KGaA and its subsidiaries under which they do business. The DWS legal entities offering products or services are specified in the relevant documentation. DWS, through DWS Group GmbH & Co. KGaA, its affiliated companies and its officers and employees (collectively “DWS”) are communicating this document in good faith and on the following basis. This document is for information/discussion purposes only and does not constitute an offer, recommendation or solicitation to conclude a transaction and should not be treated as investment advice.
This document is intended to be a marketing communication, not a financial analysis. Accordingly, it may not comply with legal obligations requiring the impartiality of financial analysis or prohibiting trading prior to the publication of a financial analysis. This document contains forward looking statements. Forward looking statements include, but are not limited to assumptions, estimates, projections, opinions, models and hypothetical performance analysis. No representation or warranty is made by DWS as to the reasonableness or completeness of such forward looking statements. Past performance is no guarantee of future results. The information contained in this document is obtained from sources believed to be reliable. DWS does not guarantee the accuracy, completeness or fairness of such information. All third party data is copyrighted by and proprietary to the provider. DWS has no obligation to update, modify or amend this document or to otherwise notify the recipient in the event that any matter stated herein, or any opinion, projection, forecast or estimate set forth herein, changes or subsequently becomes inaccurate. Investments are subject to various risks. Detailed information on risks is contained in the relevant offering documents. No liability for any error or omission is accepted by DWS. Opinions and estimates may be changed without notice and involve a number of assumptions which may not prove valid. DWS does not give taxation or legal advice. This document may not be reproduced or circulated without DWS’s written authority. This document is not directed to, or intended for distribution to or use by, any person or entity who is a citizen or resident of or located in any locality, state, country or other jurisdiction, including the United States, where such distribution, publication, availability or use would be contrary to law or regulation or which would subject DWS to any registration or licensing requirement within such jurisdiction not currently met within such jurisdiction. Persons into whose possession this document may come are required to inform themselves of, and to observe, such restrictions.
© 2024 DWS International GmbH For investors in the UK: Issued in the UK by DWS Investments UK Limited which is authorised and regulated in the UK by the Financial Conduct Authority.
© 2024 DWS Investments UK Limited CRC: 100792. 23.04.2024


