There are lots of new active ETFs being launched and a recent report from Morningstar highlighted that active ETFs are approaching a 10% share of the overall market.
Parala typically uses passive ETFs to reflect desired asset class, market, factor and sector exposures in its portfolios. However, our investment technology is also used by investors to identify manager skills and provide forward-looking rankings of actively managed investment products with an ability to identify ‘all-weather’ and time-varying manager skills with the latter linked to the business cycle.
Having a sophisticated model like Parala’s is useful for investment decisions and can also help investors understand individual ETF’s characteristics, risk factor exposures, business cycle sensitivities and sources of added value which is the goal of this article.
While the ETF wrapper itself does not boost an investment manager’s alpha-generating skills, there are some “features with benefits”. Firstly, many of the recently launched active ETFs have lower management fees than traditional mutual funds. Secondly, large fund houses can offer systematic strategies at low cost which provides investors with potential performance benefits from deep security level and/or factor research. Thirdly, active ETFs provide the flexibility for fund managers to include qualitative judgement and/or ESG research within their security selection.
The active ETFs below were selected to highlight different investment approaches within US equities provided they had a sufficient length track record for analysis. Collectively, they represent the three “features with benefits” although two of the ETFs have fees more typical of actively managed mutual funds. Since four of the five ETF offerings include ESG features, the MSCI USA ESG Leaders index is included in the analysis to approximate any differentiated performance attributable to a passive benchmark exposure incorporating ESG criteria.
Chart 1: Actively managed US Equity UCITS ETFs in our analysis
Ticker | Name | AUM ($m) | TER | ESG Criteria | Inception Date |
|---|---|---|---|---|---|
FUSR | $351 | 0.20% | Yes | Jun-20 | |
UINC | $302 | 0.65% | No | Apr-16 | |
JREU | $9,530 | 0.20% | Yes | Oct-18 | |
5HED | Ossiam ESG Low Carbon Shiller Barclays CAPE US Sector UCITS ETF | $76 | 0.75% | Yes | Jun-18 |
OUFU | $35 | 0.45% | Yes | Jun-19 |
Source: Bloomberg as of 12 August 2024
Investment strategies with distinct levels of active risk
There are three types of strategies being employed across these five ETFs:
Research-based security selection to add value. Sector weights are kept close to the benchmark. This includes the Fidelity Sustainable Research Enhanced US Equity UCITS ETF and the JPM US Research Enhanced Index Equity (ESG) UCITS ETF. Notice that both offerings include the word ‘Enhanced’ so they must be good.
Low carbon factor-based research and portfolio construction to add value. Sector weights may deviate significantly from the S&P 500 to provide lower than market benchmark levels of carbon exposure. The Ossiam ESG Low Carbon Shiller Barclays CAPE US Sector UCITS ETF and Ossiam US ESG Low Carbon Equity Factors UCITS ETF are examples of this approach.
Higher income investment objective to add value. The tilt toward income-generating securities without tight sector controls means the weights deviate significantly from the S&P 500. The First Trust US Equity Income UCITS ETF reflects this type of investment strategy.
Chart 2: Active sector weights relative to the S&P 500 index
Sector | Fidelity Sustainable Research Enhanced US Equity | First Trust US Equity Income | JPMorgan US Research Enhanced Index Equity (ESG) | Ossiam ESG Low Carbon Shiller Barclays CAPE US | Ossiam US ESG Low Carbon Equity Factors |
|---|---|---|---|---|---|
Communication Services | -0.3 | -5.9 | -0.4 | 16.3 | 1.8 |
Consumer Discretionary | -0.6 | -5.3 | 1.3 | 13.9 | 3.9 |
Consumer Staples | -0.4 | 1.2 | -0.8 | 18.4 | -0.4 |
Energy | 0.1 | 16.4 | 0.0 | -3.7 | -2.9 |
Financials | 1.0 | 29.6 | -0.1 | 13.6 | 17.0 |
Health Care | 1.1 | -6.4 | 0.1 | -12.3 | -7.5 |
Industrials | -1.1 | -6.5 | -0.6 | -8.5 | -1.1 |
Information Technology | -0.6 | -26.9 | 0.5 | -30.6 | -17.2 |
Materials | 0.4 | 2.4 | -0.2 | -2.2 | -0.7 |
Real Estate | 0.4 | 1.2 | -0.1 | -2.3 | 2.7 |
Utilities | -0.4 | 0.3 | 0.0 | -2.5 | 4.4 |
Not classified | 0.3 | 0.0 | 0.3 | 0.0 | 0.0 |
Source: Bloomberg as of 8 August 2024
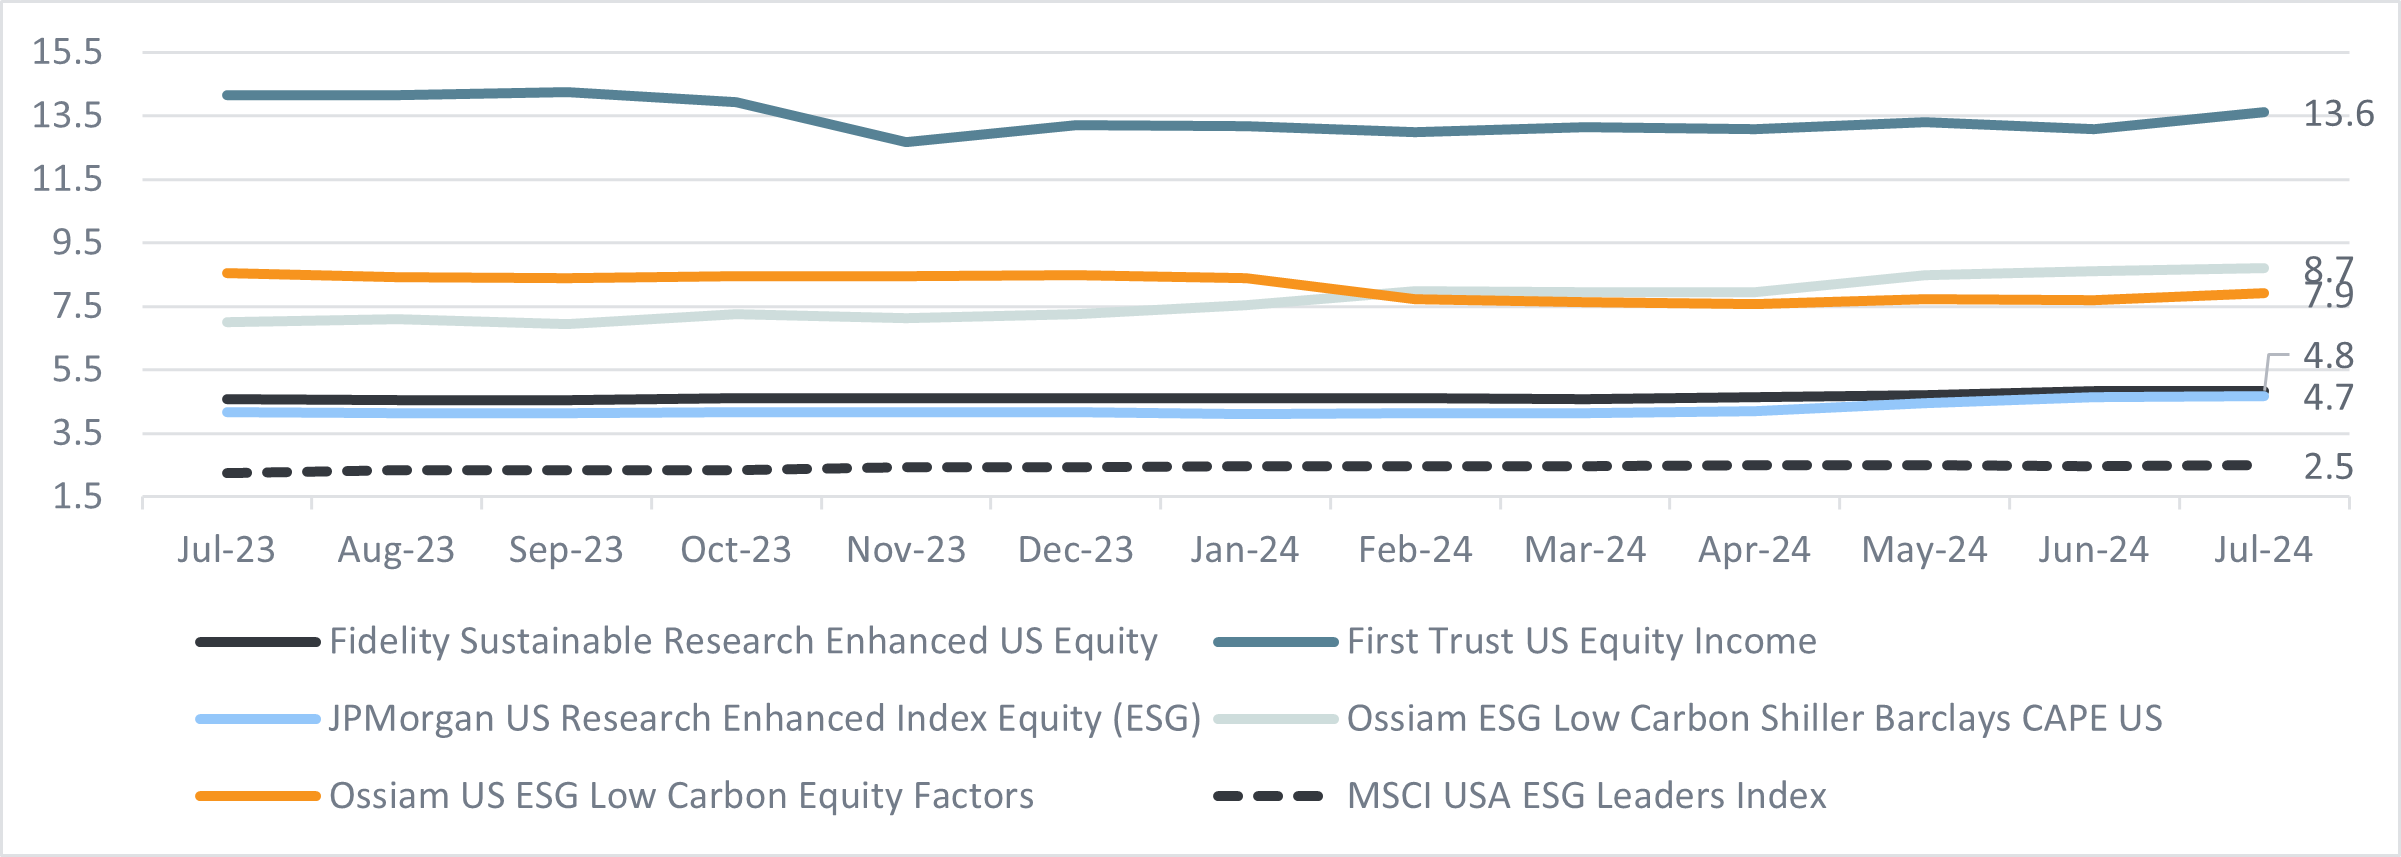
The ETFs with the lowest tracking error relative to the S&P 500 index are the Fidelity and JP Morgan ETFs. They both seek to add value through security-level research and their sector weights are kept close to the benchmark. ETFs with higher levels of tracking error include both Ossiam ETFs with their overweight in financials and underweight in healthcare and information technology.
There are other ETFs in the market that seek to reduce carbon exposure while controlling for active sector risks relative to a market benchmark, but this is not a feature of the two Ossiam ETFs. With an annualised tracking error relative to the S&P 500 of over 13%, the clear ‘category’ winner with its income-seeking investment objective and overweight in financials and energy and underweight in five sectors led by information technology, is the First Trust Equity Income ETF. Lastly, you can see that employing ESG in the selection criteria adds around 2.5% tracking error as illustrated by the MSCI USA ESG Leaders index.
Chart 3: Rolling three-year annualised tracking error relative to the S&P 500 index
Source: Parala Capital LLP with ETF performance data from Bloomberg
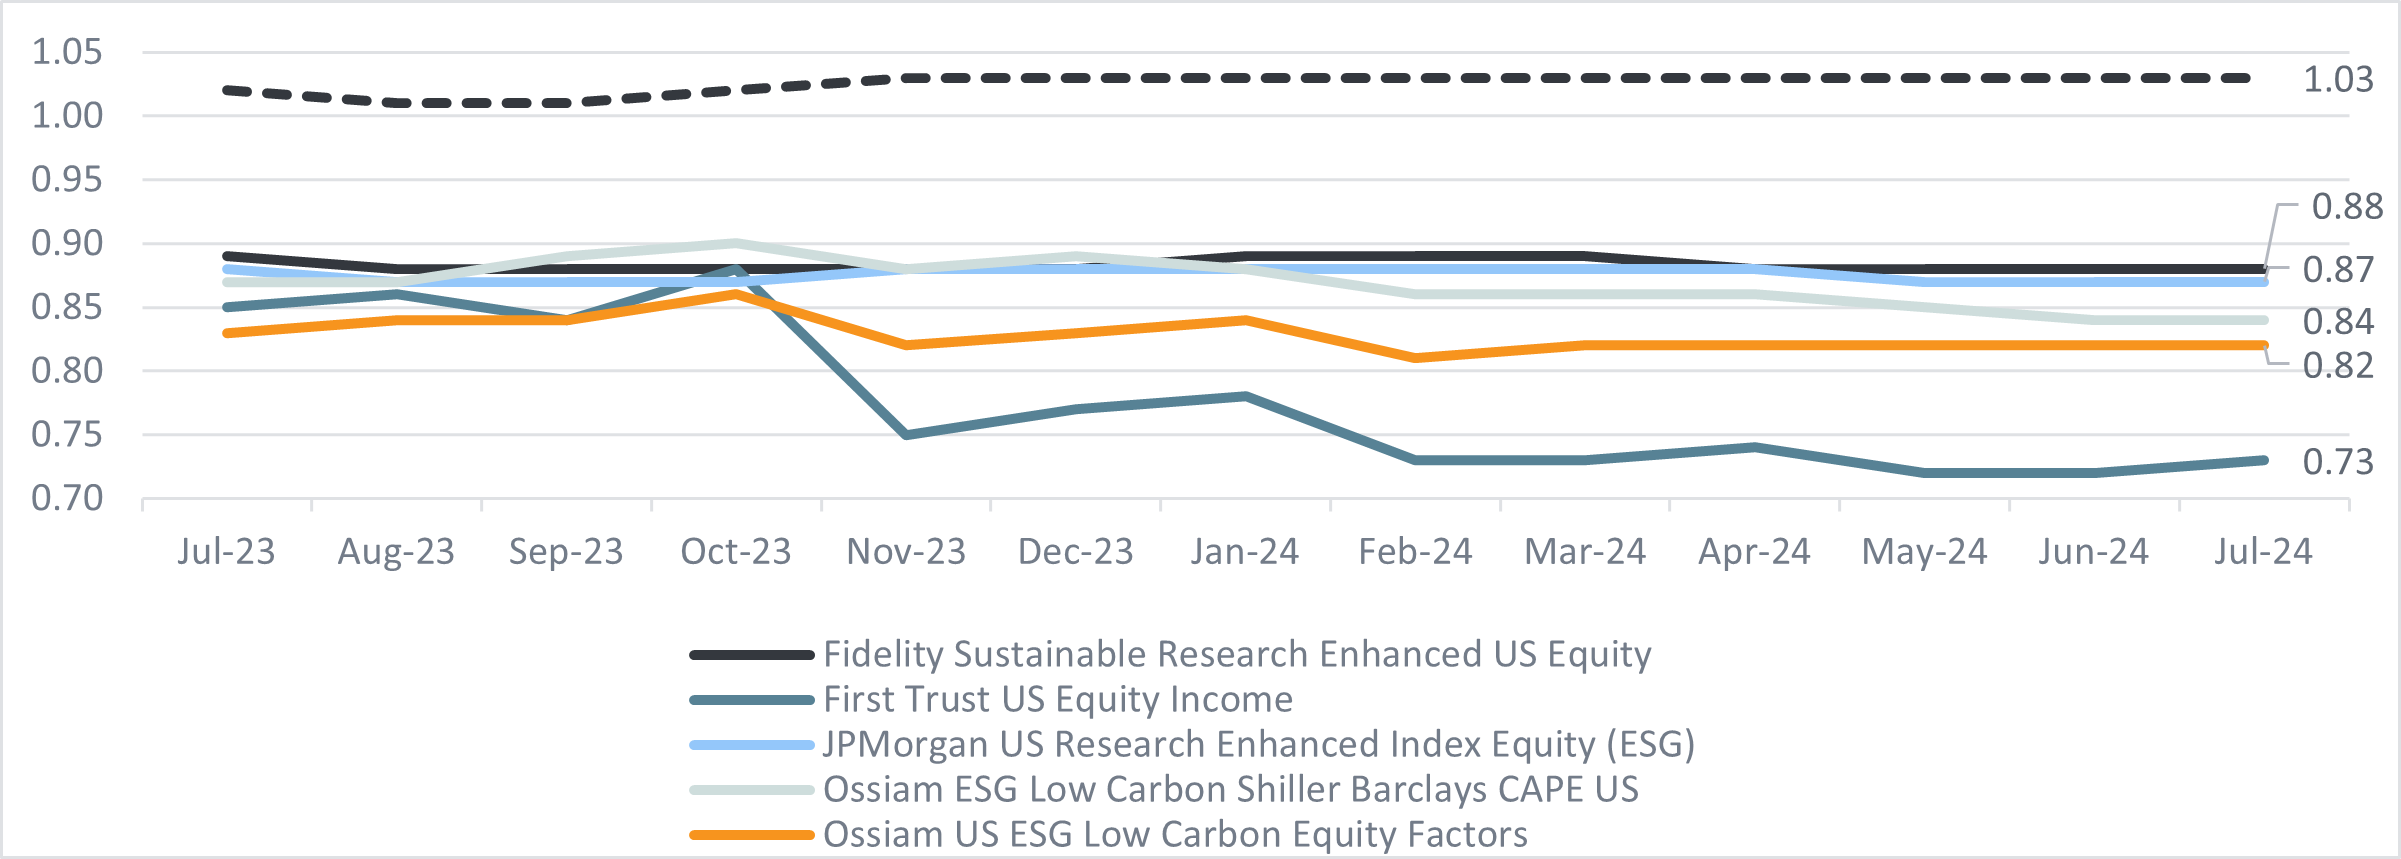
Beta measures the level of systemic risk of an investment strategy relative to a market benchmark like the S&P 500. The chart below shows us the market beta of the five ETFs over consecutive rolling three-year periods. A strategy with a beta of one has a systematic risk equivalent to the S&P 500 which is about what we see for the MSCI USA ESG Leaders index. We can see from the below chart that the five ETFs all have lower market betas than the S&P 500.
What this means in practice is that these ETFs have other risk factor exposures that are not captured by the market benchmark, and we will take a closer look at what those risk factor exposures are shortly. Also noteworthy is that the First Trust US Equity Income ETFs market beta exposure declines over subsequent rolling three-year periods.
Chart 4: Rolling three-year market beta relative to the S&P 500 index
Source: Parala Capital LLP with ETF performance data from Bloomberg
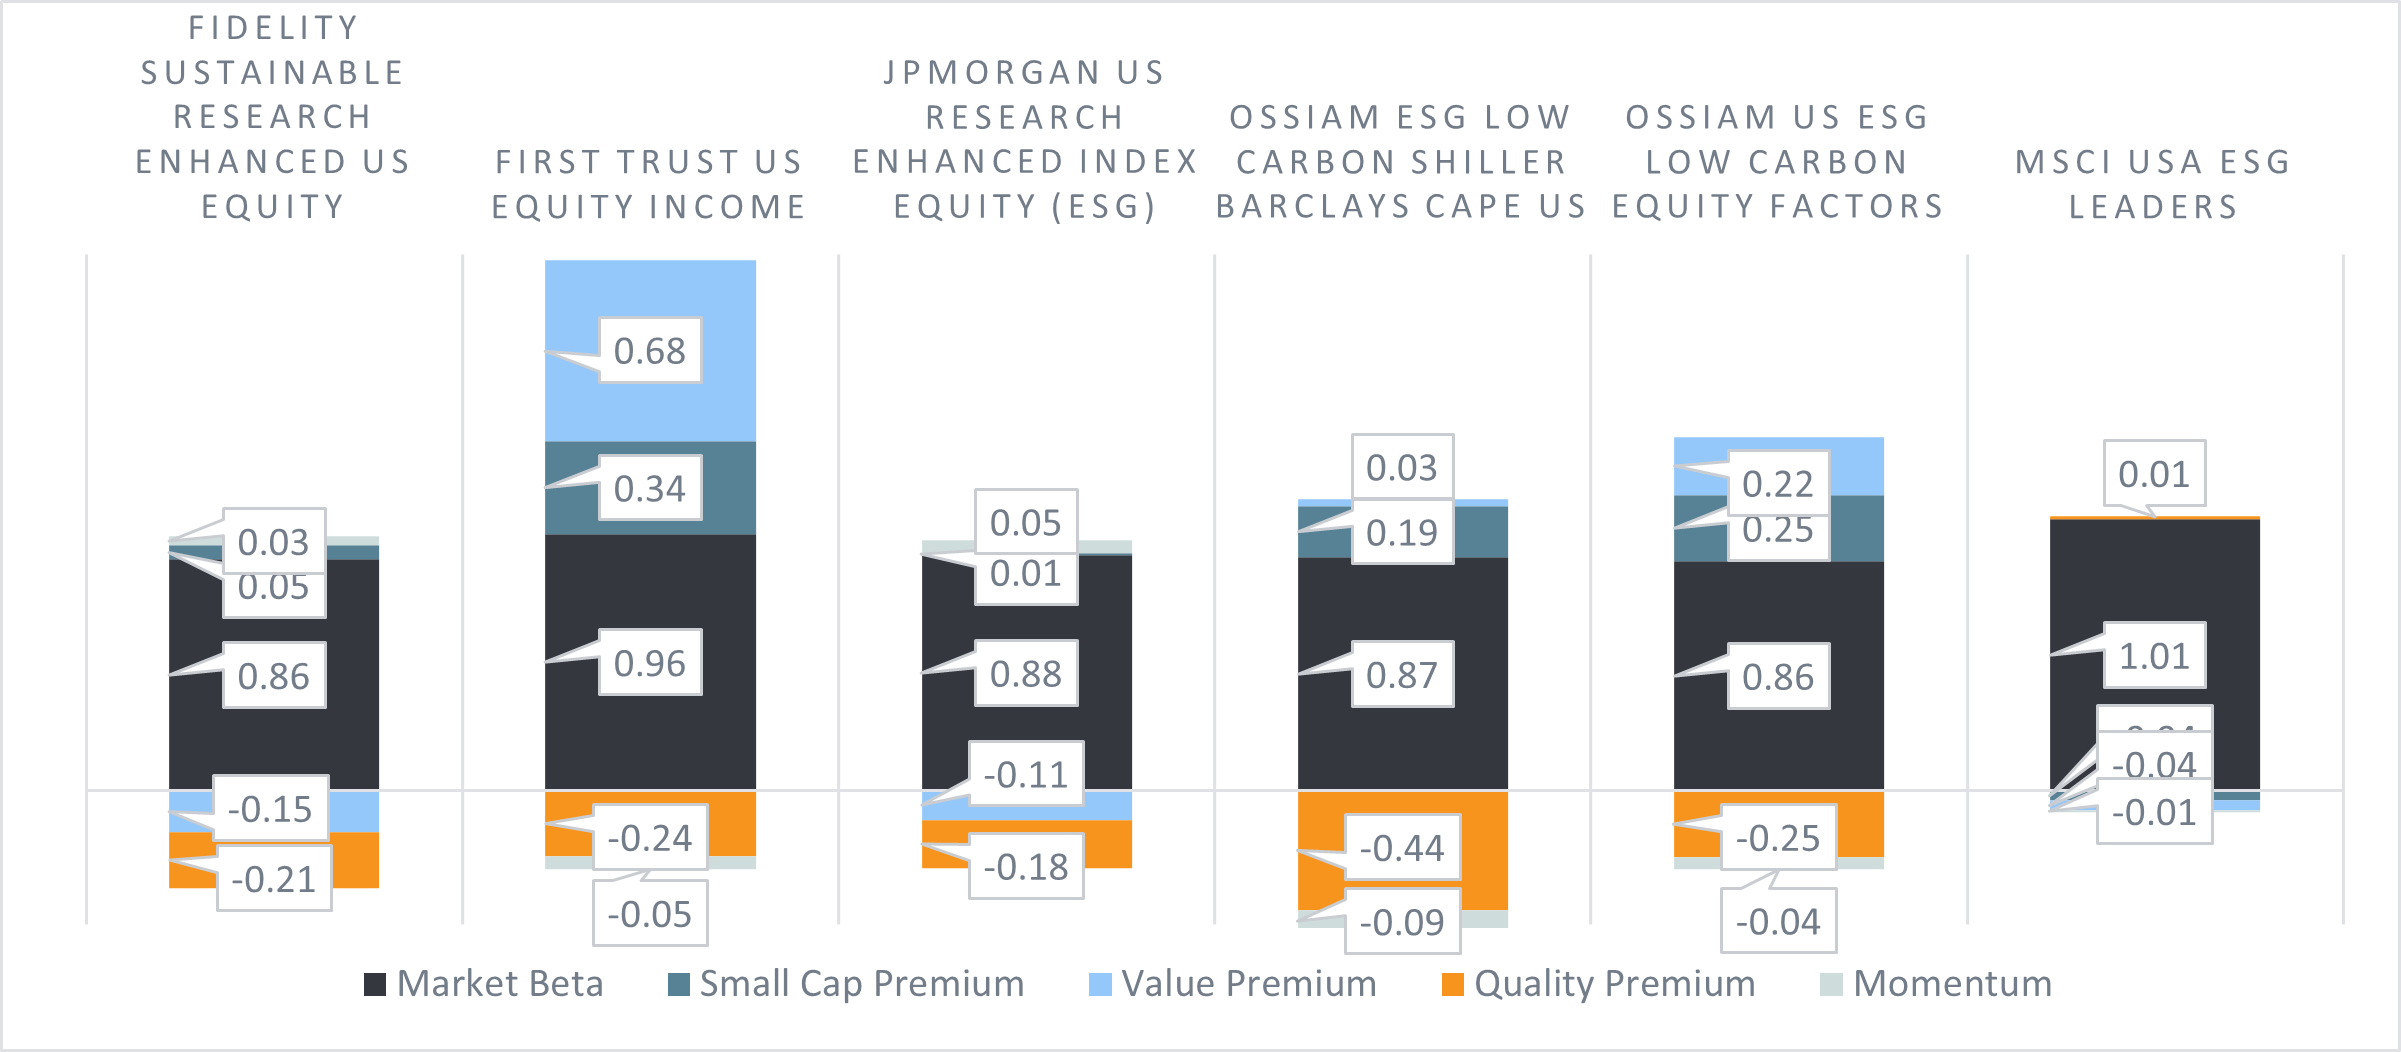
We can now engage in a deeper analysis to see which combination of factors best explains each ETFs returns. We can see that all the ETFs have different risk factor exposures. The Fidelity and JP Morgan ETF have similar risk factor exposures which is not surprising given they both impose tight sector risk limits relative to the S&P 500. Therefore, the main differences in their respective performances will come from their “all-weather” and time-varying alpha skills since they also have the same stated management fee.
The fund with the largest exposure to the value premium is First Trust US Equity Income which is unsurprising given its focus on income. The ETF with the next largest exposure to the value premium is the Ossiam US ESG Low Carbon Equity Factors ETF.
Interestingly, its sibling, the Ossiam ESG Low Carbon Barclays Cape US ETF has a much lower exposure to the value premium which is explained by its higher exposure to NASDAQ-type growth companies including an overweight in the communications sector (think Google, Netflix and Meta) and lower exposure to traditional value sectors. Perhaps most interesting is the negative exposure of all the ETFs to the quality premium (high-quality stock returns minus low-quality stock returns). This is surprising given asset managers in the financial media frequently mention their focus on quality.
That may be the case, but clearly the returns generated by these ETFs have a negative correlation with the quality premium. Lastly, the Fidelity and JP Morgan ETFs have the lowest exposure to the small cap premium whereas First Trust US Equity Income and the two Ossiam ETFs have a reasonably large exposure to the small cap premium. The First Trust and two Ossiam ETFs are underweight information technology whose market capitalisation has grown substantially which at least partially explains why they have a higher exposure to the small cap premium.
Chart 5: Long-term risk factor exposures of each of the five active US equity ETFs
Source: Parala Capital LLP
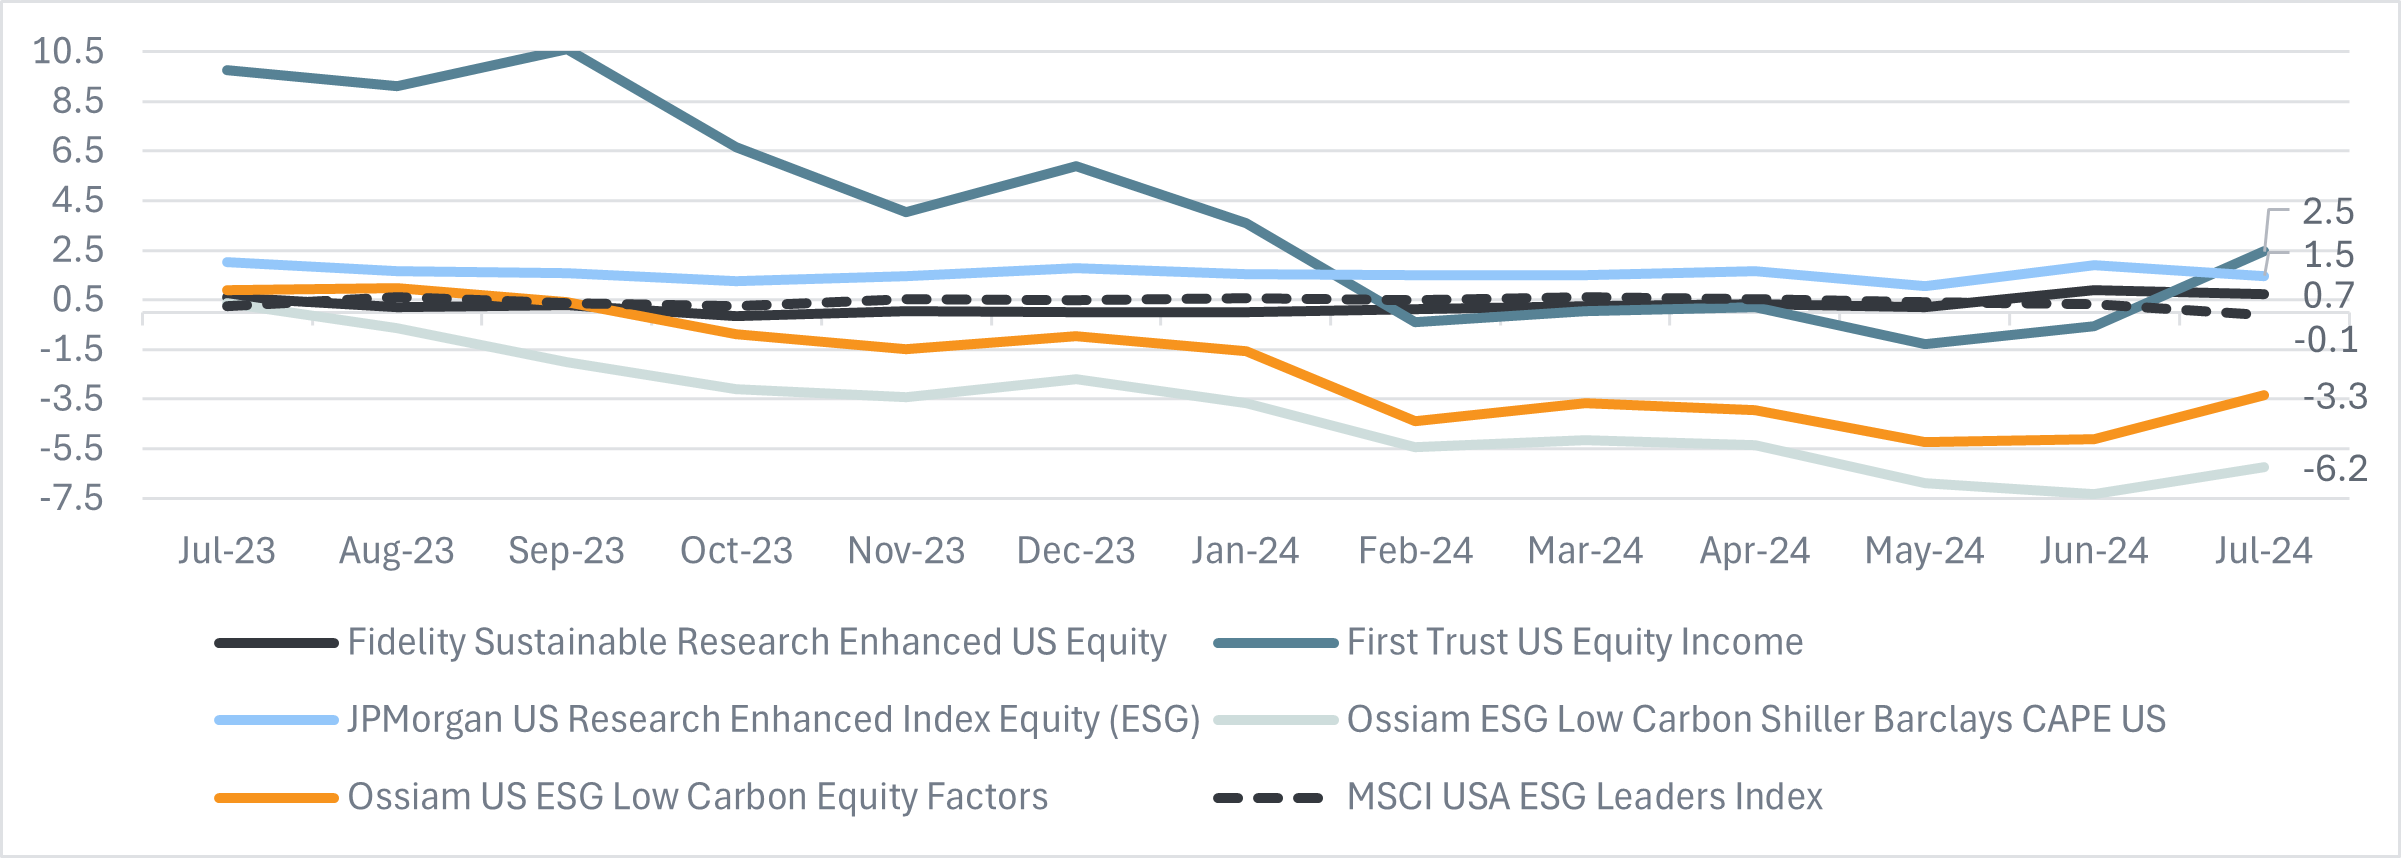
With the caveat that we are measuring alpha over a relatively short time span during a period of high dispersion, we can see that the First Trust US Equity Income has the highest average rolling three-year annualised alphas and the Ossiam US ESG Low Carbon Equity Factors and Ossiam ESG Low Carbon Shiller Barclays CAPE US ETFs have the lowest.
When comparing the Fidelity and JP Morgan ETFs, the two ETFs with similar beta risk factors, sector exposures and the same stated management fees, we see differences in their levels of alpha which likely comes from differences in their “all-weather” and time-varying skills (i.e. alpha). The JP Morgan ETF generates higher three-year annualised rolling alphas overall observations.
We will look deeper into the correlation between their alpha skills and the business cycle in the next section which will help explain why JP Morgan may have done better given the economic conditions over the last few years.
Chart 6: Rolling three-year alpha relative to the S&P 500 index
Source: Parala Capital LLP with ETF performance data from Bloomberg
When evaluating the risk and return behaviour of these actively managed UCITS ETFs, Parala’s model captures not only each ETF’s exposure to risk factors including market beta, small cap, value, quality and momentum risk premiums but also the fact that the performance of the risk factors themselves are sensitive to the business cycle.
Each ETF also has an important residual component of its return which is independent of the risk factors but is correlated with the business cycle. We can call this component of the return time-varying alpha because it varies over time and is associated with navigating changes in the business cycle.
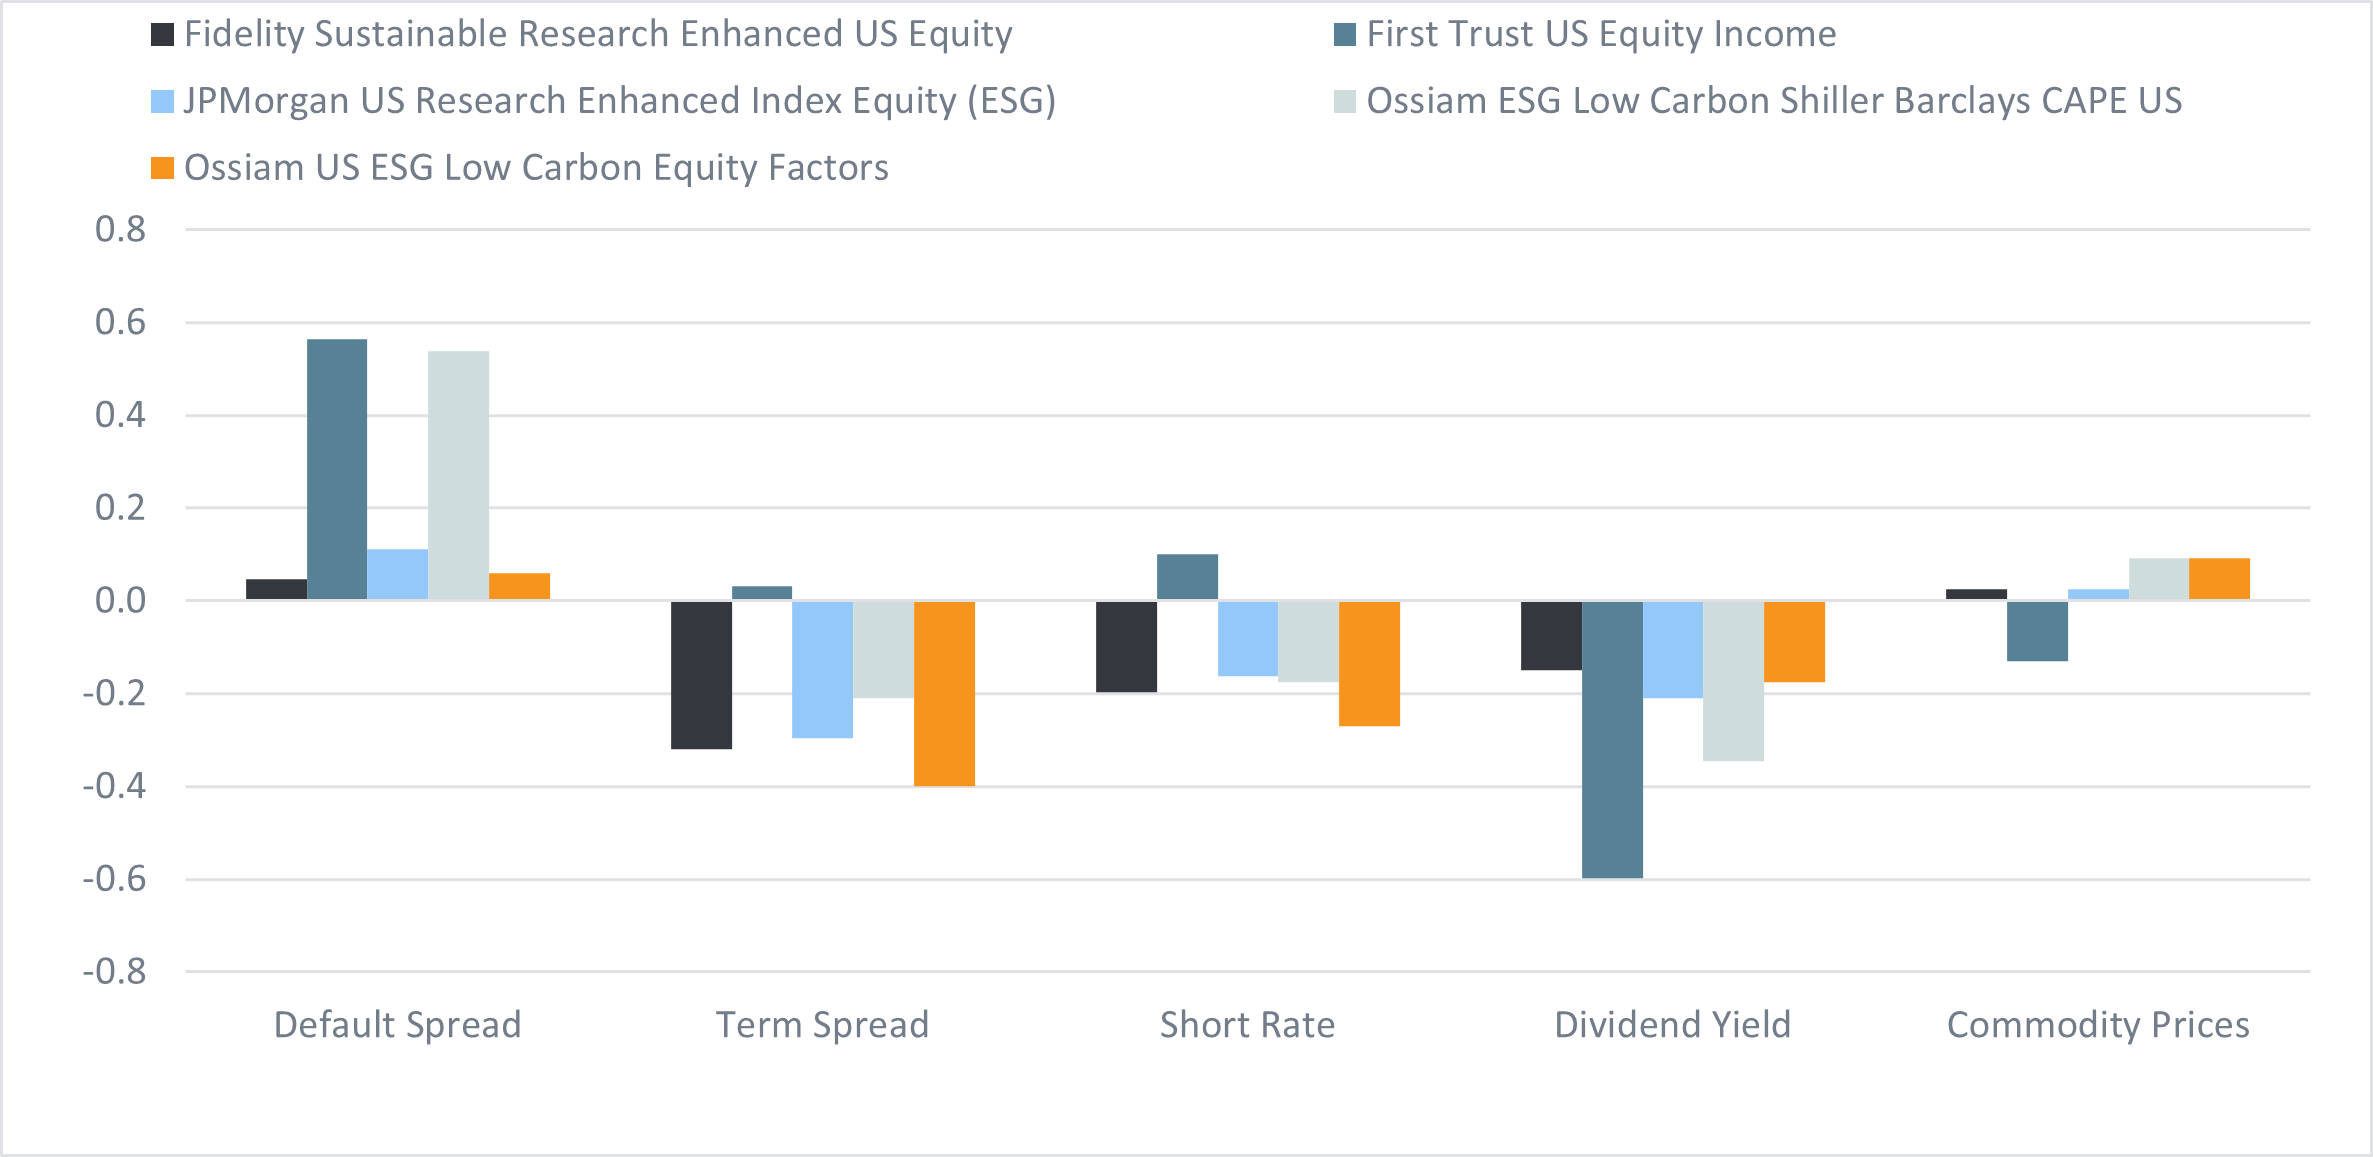
It may be due to differences in each ETF’s active sector weights and/or security selection within each sector. We identify these relationships using important business cycle variables like the default spread, term spread, short-term interest rate and commodity prices.
Fidelity and JP Morgan ETFs have similar beta risk factor exposures and the main difference in their performance may come from differences in their alpha skills. The chart below shows the sensitivity of each fund’s alpha skills to important business cycle variables. We can see that Fidelity Sustainable Research Enhanced US Equity and JPMorgan US Research Enhanced Index Equity (ESG) have different sensitivities to these important business cycle variables which lead to differences in their time-varying alphas.
For example, Fidelity Sustainable Research Enhanced US Equity alpha skill has a higher negative sensitivity to term spread and short-term interest rates than JPMorgan US Research Enhanced Index Equity (ESG) and a lower negative sensitivity to changes in the dividend yield which is a proxy for changes in stock valuations but also captures slow moving cyclical trends in the economy.
With a sophisticated investment model, these alpha sensitivities can be monitored over time allowing investors the ability to tilt toward funds that are likely to do better given the state of the economy and avoid those that are likely to fare worse. For example, if you expect the default spread (credit risk) to increase, the First Trust US Equity Income and Ossiam ESG Low Carbon Shiller Barclays CAPE US may perform better than the other ETFs in this analysis given their higher positive sensitivity to the default spread.
Chart 7: US active ETF alpha sensitivities to business cycle variables
Conclusion
Over the last decade, investors have embraced indices, ETFs and passive investing at the expense of active management. However, active ETFs are becoming an increasing segment of the ETF market. Is it time for investors to get more active with their US investment allocations?
Being active can be good for one’s health and well-being but it does take more time and effort. Active ETFs cover a range of strategies seeking to add value from security level research, combining risk factors, incorporating ESG and qualitative judgement.
For investors that embrace the ETF wrapper, the proliferation of active ETFs just increases the tools in the toolkit. However, not all ETFs track public indices so transparency may be more limited. It may be more challenging to gain a clear understanding of the investment objectives, risk limits, constant and time-varying risk factor exposures, economic sensitivities and sources of alpha. These are important considerations to ensure that the active ETFs fit within an investor’s overall portfolio and add value.
Steve Goldin is managing partner at Parala Capital, which provides institutional investors and asset owners with asset allocation advice using advanced quantitative technology based on the academic research of its founding partners
This article first appeared in ETF Insider, ETF Stream's monthly ETF magazine for professional investors in Europe. To read the full edition, click here.


