Darkest before the dawn
UK equities remain one of the most unloved asset classes globally. As we all know, however, markets are cyclical, with the point of maximum pessimism often representing a buying opportunity. At the moment, investors are very pessimistic about the UK’s prospects compared to other equity markets, with the MSCI UK index trading at its widest discount to the MSCI World index since 1975.¹
Yet, while the idea of the UK market outperforming may seem alien to many who have joined the industry in the last decade, from 2000 to 2010 the UK was actually one of the top-performing markets, outperforming both the S&P 500 and the MSCI World.²
This golden era for UK equities was heralded by the popping of the tech bubble. Today, with valuations once again extended in many markets and in several sectors, the UK looks very attractive when compared to other developed equity markets around the world.
Why pay more for the same type of global company?
One of the challenges for the UK market is its sector composition, particularly the low weighting towards technology stocks compared to the US, for example.
However, while differences in sector weights account for some of the valuation gap between the UK and other stock markets, it is difficult to explain why comparable companies should trade on such different valuations based on where they are listed.
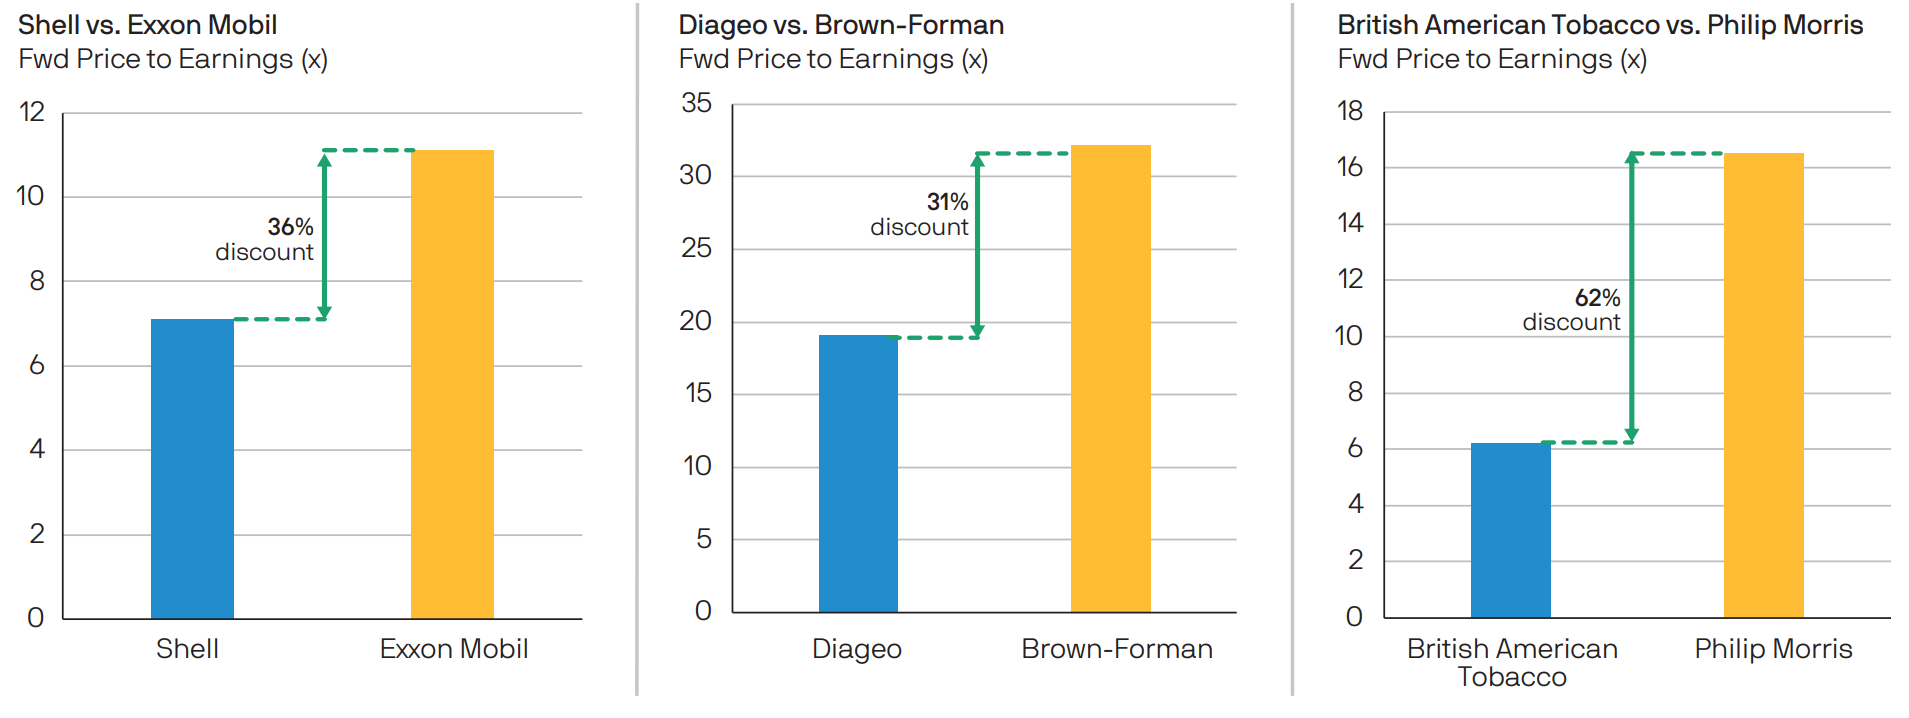
Take the valuation of UK-listed leaders in the oil, beverage and tobacco sectors compared to competitors in other markets as an example. Shell and Exxon are both oil majors with global asset bases, Diageo and Brown-Forman are spirit makers, and British American Tobacco and Philip Morris are tobacco/nicotine products companies. In each case, there is a significant valuation gap between the UK-listed company and its global peer.
These large valuation discounts tend to be noticed eventually, either through public markets closing the valuation gap or through M&A and other corporate activity. We have already seen several bids in the UK market this year, which is just another signal of how cheap the UK market is at the moment.
Chart 1: Global forward price-to-earnings ratios

Source: IBES, MSCI, Refinitiv Datastream, S&P Global, J.P. Morgan Asset Management. Forward P/E ratio is price to 12-month forward earnings. MSCI indices are used for all regions/countries (due to data availability), except for the US, which is represented by the S&P 500. Range and average for China is since 1996, due to data availability. Past performance is not a reliable indicator of current and future results. Guide to the Markets -UK. Data as of 30 June 2023.
Low-cost, active ETF exposure to the UK market
JUKE provides investors with a cost effective and efficient way to allocate to the valuation opportunity in the UK market. This actively managed UK equity ETF may be just one year old, but the investment process and the team behind the strategy have been designed to build upon the success of the JPM UK Equity Core Fund, a long-established OEIC that has delivered strong returns. The strategy’s portfolio management team – James Illsley, Callum Abbot, Chris Llewelyn and Zach Chadwick – have an average of over 20 years of industry experience and are part of a wider team of UK specialists with significant experience investing in the UK.
Available for an ongoing charge of just 25 basis points, JUKE provides access to a once-in-a-generation valuation opportunity in the UK market, backed by a team of specialist UK equity portfolio managers with a long track record.
Chart 2: Valuation gap of selected UK stocks (forward price-to-earnings ratio)

Source: J.P. Morgan Asset Management, as at 14 July 2023. The securities above are shown for illustrative purposes only. Their inclusion should not be interpreted as a recommendation to buy or sell. Opinions, estimates, forecasts, projections and statements of financial market trends are based on market conditions at the date of the publication, constitute our judgment and are subject to change without notice. There can be no guarantee they will be met
To find out more about the JPM UK Equity Core UCITS ETF click here.
1 Source: J.P. Morgan Asset Management using data from MSCI, I/B/E/S, Morgan Stanley Research. Based on PE (Price to Earnings), PBV (Price to Book Value) and PD (Price to Dividend). Average relative valuations use 12 month forward data where available. Data from 31 December 1974 to 31 March 2023. 2 Source: J.P. Morgan Asset Management using data from Bloomberg
Important information
For Professional Clients / Qualified Investors only – not for Retail use or distribution. This is a marketing communication and as such the views contained herein do not form part of an offer, nor are they to be taken as advice or a recommendation, to buy or sell any investment or interest thereto. Reliance upon information in this material is at the sole discretion of the reader. Any research in this document has been obtained and may have been acted upon by J.P. Morgan Asset Management for its own purpose. The results of such research are being made available as additional information and do not necessarily reflect the views of J.P. Morgan Asset Management. Any forecasts, figures, opinions, statements of financial market trends or investment techniques and strategies expressed are, unless otherwise stated, J.P. Morgan Asset Management’s own at the date of this document. They may not necessarily be all-inclusive and are not guaranteed as to accuracy. They may be subject to change without reference or notification to you. The value of investments and the income from them may fluctuate in accordance with market conditions and taxation agreements and investors may not get back the full amount invested. Changes in exchange rates may have an adverse effect on the value, price or income of the products or underlying overseas investments. Past performance and yield are not a reliable indicator of current and future results. There is no guarantee that any forecast made will come to pass. Furthermore, there can be no assurance that the investment objectives of the investment products will be met. J.P. Morgan Asset Management is the brand name for the asset management business of JPMorgan Chase & Co. and its affiliates worldwide. To the extent permitted by applicable law, we may record telephone calls and monitor electronic communications to comply with our legal and regulatory obligations and internal policies. Personal data will be collected, stored and processed by J.P. Morgan Asset Management in accordance with our EMEA Privacy Policy www.jpmorgan.com/emea-privacy-policy. As the product may not be authorised or its offering may be restricted in your jurisdiction, it is the responsibility of every reader to satisfy himself as to the full observance of the laws and regulations of the relevant jurisdiction. Prior to any application investors are advised to take all necessary legal, regulatory and tax advice on the consequences of an investment in the products. Shares or other interests may not be offered to or purchased directly or indirectly by US persons. All transactions should be based on the latest available Prospectus, the Key Information Document (KID) and any applicable local offering document. These documents together with the annual report, semi-annual report, instrument of incorporation and sustainability-related disclosures, are available in English from JPMorgan Asset Management (Europe) S.à r.l., 6 route de Trèves, L-2633 Senningerberg, Grand Duchy of Luxembourg, your financial adviser or your J.P. Morgan Asset Management regional contact or at www.jpmorganassetmanagement.ie. A summary of investor rights is available in English at https://am.jpmorgan.com/lu/investor-rights. J.P. Morgan Asset Management may decide to terminate the arrangements made for the marketing of its collective investment undertakings. Units in Undertakings for Collective Investment in Transferable Securities (“UCITS”) Exchange Traded Funds (“ETF”) purchased on the secondary market cannot usually be sold directly back to UCITS ETF. Investors must buy and sell units on a secondary market with the assistance of an intermediary (e.g. a stockbroker) and may incur fees for doing so. In addition, investors may pay more than the current net asset value when buying units and may receive less than the current net asset value when selling them. In Switzerland, JPMorgan Asset Management Switzerland LLC (JPMAMS), Dreikönigstrasse 37, 8002 Zurich, acts as Swiss representative of the funds and J.P. Morgan (Suisse) SA, Rue du Rhône 35, 1204 Geneva, as paying agent. With respect to its distribution activities in and from Switzerland, JPMAMS receives remuneration which is paid out of the management fee as defined in the respective fund documentation. Further information regarding this remuneration, including its calculation method, may be obtained upon written request from JPMAMS. This communication is issued in Europe (excluding UK) by JPMorgan Asset Management (Europe) S.à r.l., 6 route de Trèves, L-2633 Senningerberg, Grand Duchy of Luxembourg, R.C.S. Luxembourg B27900, corporate capital EUR 10.000.000. This communication is issued in the UK by JPMorgan Asset Management (UK) Limited, which is authorised and regulated by the Financial Conduct Authority. Registered in England No. 01161446. Registered address: 25 Bank Street, Canary Wharf, London E14 5JP. LV–JPM54395 | 07/23 | 09zl231807113008


