Secondary market volumes and assets under management (AUM) are limited ways to assess an ETF’s liquidity, according to a Jane Street report.
The report, titled The European ETF Liquidity Landscape, said the “temptation” from small secondary market volumes in Europe is to conclude that “liquidity in European ETFs is typically thin”.
According to data from Jane Street, European ETFs accounted for 14% of secondary trading volumes in the equity market in 2022 versus 30% of secondary trading for US ETFs.
However, the report said trading is not a good indicator of an ETF’s liquidity because it does not take into account the underlying market.
Because authorised participants can create and redeem ETF shares, large orders are able to be executed due to the liquidity of the underlying constituents.
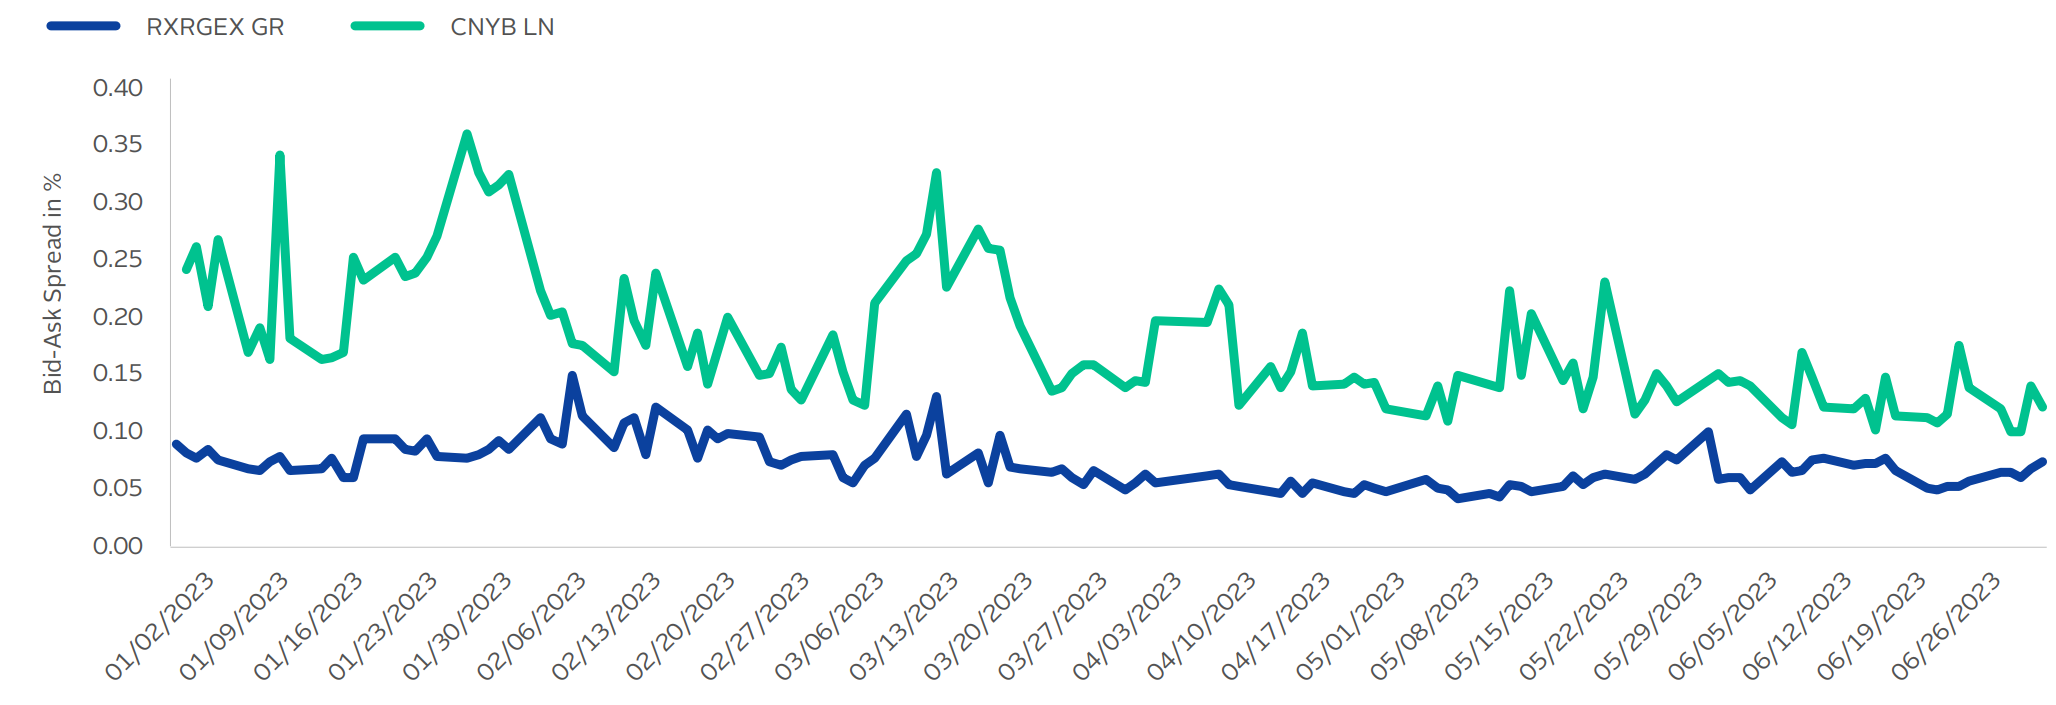
Highlighting this, the iShares be.rexx Government Germany UCITS ETF (RXRGEX), which has $262m AUM, consistently trades at a tighter spread versus the iShares China CNY Bond UCITS ETF (CNYB), which has $2.6bn AUM.
The report said this stems from the liquidity available in RXRGEX’s underlying holdings despite the ETF having far less AUM than CNYB.
Chart 1: Bid-ask-spread of RXRGEX and CNYB in comparison (H1 2023)

Source: Bloomberg and Jane Street analysis, as of July 2023
Peter Whitaker, head of EMEA market structure at Jane Street, and author of the report, said: “The market is able to trade in size partly due to the liquidity of the underlyings and creation-redemption mechanism available with ETFs.
“In addition, liquidity in an ETF can be enhanced through liquidity in different but correlated products tracking the same or similar indices, again using mechanisms such as the ETF primary market.
“These facts about an ETF’s liquidity are not apparent from the AUM or the on-exchange volumes of the ETF itself.”
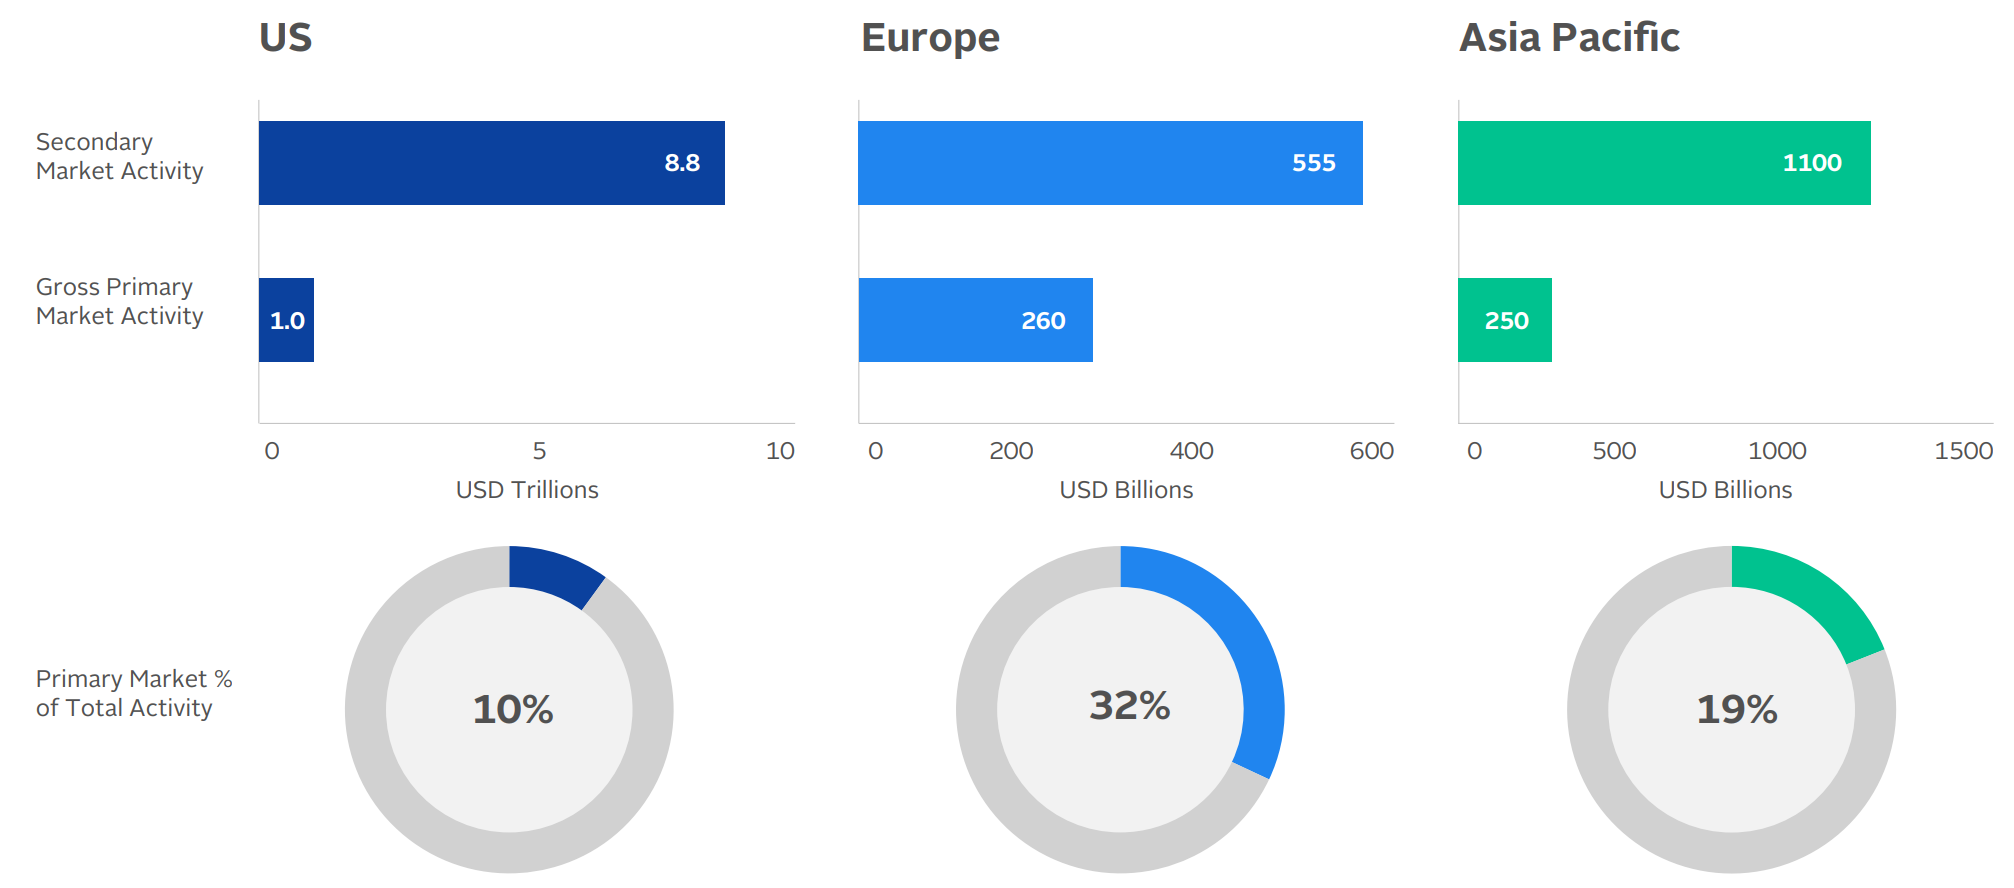
This is particularly true for Europe, given the higher primary market activity. According to data from Jane Street, the ratio for primary market trades is 2:1 against the secondary market versus 9:1 for the US.
Chart 2: Primary and secondary market activity in Q2 2023

Source: Blackrock and Jane Street, July 2023
This highlights the importance of understanding the underlying market an ETF offers exposure to rather than simply assessing its total AUM or the daily trading volumes.
“Europe’s ETF market continues to gather assets and offer investors new ways to help their investment process. It offers investors high levels of choice and products tailored to their needs,” Whitaker explained.
“The liquidity landscape and market structure prevalent in Europe arguably has optimised to these needs. While trading in individual ETFs may be sporadic, the products and market as a whole have high levels of liquidity through the risk capital deployed.”


