As active managers managing pure ETF portfolio, SCM Direct recently undertook the strategic asset allocation decision to reallocate 3% of our assets from short-term duration ETFs to longer-maturity sterling corporate bonds.
A decision driven by a detailed analysis of the current yield curve and reflecting our anticipation of future interest rate cuts, which should lead to an overall downward shift in the curve across all maturities).
The yield curve and strategic implications
The yield curve, a key indicator in bond markets, shows the relationship between bond yields and their maturities.
Normally, the yield curve slopes upwards, with long-term bonds offering higher yields to compensate for the greater risks associated with time. However, when the yield curve flattens, the difference between short-term and long-term yields narrows, indicating an expectation that interest rates will fall.
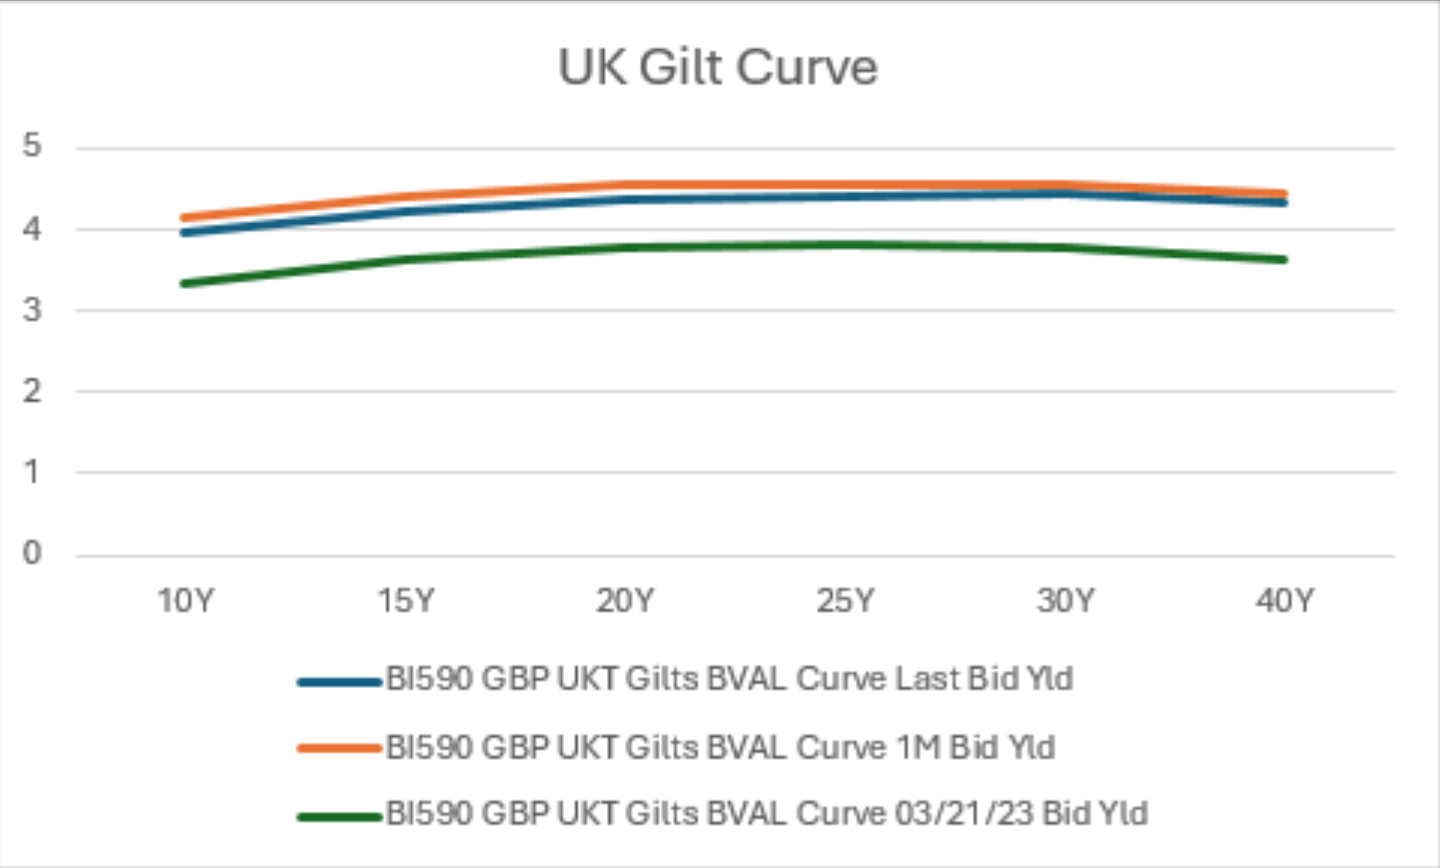
Recently, the UK yield curve has exhibited a relatively flat shape, with long-term bond yields only slightly higher than those of shorter-term bonds.
This flattening suggests future interest rate cuts by the Bank of England, which could cause the yield curve to shift downward. In such an environment, longer-maturity bonds become more attractive, offering higher yields and the potential for significant capital gains.
Moving from short-term to long-term bonds
SCM Direct’s decision to reduce holdings in short-term bonds, particularly in the iShares GBP Corp Bond 0-5YR UCITS ETF (IS15) and to increase allocation to longer-maturity sterling corporate bonds is calculated to capitalise on expected market conditions.
It focuses on bonds with maturities between 0-5 years, has an effective maturity of 2.59 years, a weighted average yield to maturity of 5.16% and a portfolio predominantly consisting of A-rated (42.70%) and BBB-rated (45.50%) bonds.
While this ETF offers lower volatility and some protection against rate hikes, its yields are less compelling in a flat yield curve environment.
The narrow yield spread between short-term and long-term bonds reduces the appeal of shorter maturities, especially when future interest rate cuts are expected.
Analysing longer maturity ETFs
SCM Direct has reallocated assets into longer-maturity sterling corporate bonds through ETFs such as the SPDR Bloomberg Sterling Corporate Bond UCITS ETF (SUKC) and the iShares Core GBP Corporate Bond UCITS ETF (SLXX). These ETFs are well-positioned to benefit from a potential downward shift in the yield curve.
SUKC
S&P Rating:
A (42.85%) and BBB (47.73%) bonds
Yield to Maturity:
5.21%
Average Maturity:
8.67 years
Issuer Profile:
This ETF includes sterling-denominated bonds from major international corporations – including HSBC, Bank of America, and AT&T, providing diversified exposure to global credit markets.
SLXX
S&P Rating:
A-rated (42.48%) and BBB-rated (44.15%) bonds
Yield to Maturity:
5.12%
Average Maturity:
8.68 years
Issuer Profile:
This ETF features a global mix of companies, including Barclays, Electricité de France, and Goldman Sachs.
Comparing short-term and long-term bond strategies
The short-term ETF, with its lower duration and shorter maturities, has been effective in managing volatility and minimising interest rate risk; however, in a flat yield curve environment, the incremental yield offered by longer maturities becomes more attractive.
The longer-maturity ETFs not only offer higher yields but also the potential for capital gains if interest rates fall, as bond prices rise.
Conclusion
By reallocating assets from short-term bonds to longer maturities, SCM Direct has positioned our portfolio to benefit from higher yields and potential capital gains.
The inclusion of sterling-denominated bonds from global issuers further diversifies risk, ensuring a well-rounded Portfolio prepared to capitalise on future market shifts.
The below graph illustrates the current UK yield curve and the yield spread between short-term and long-term bonds at present (blue line) versus 1 month ago (red line) and in March last year (grey line), highlighting the narrow gap that informed SCM Direct's strategic asset allocation decision.

Source: SCM Direct
Alan Miller is CIO at SCM Direct


