The last quarter of 2018 was a stark reminder why investing in stocks and shares is never a sure thing. Equities - notably the S&P 500 - wiped out its gains from the year in the space of a few months, falling nearly 20% from 2,930.75 on 20
th
September to 2,351.10 on 24
th
December.
At the same time volatility - as measured by The Chicago Board Options Exchange SPX Volatility Index (VIX) - rocketed by 211% from 11.80 on 20th September to 36.7 on 24th December.
It would be fair to think that one way to avoid incurring losses at this time - aside from not being invested in the S&P 500 - could have been through minimum volatility ETFs. They are - after all - designed to help minimise volatility, but much help are they really?
The FT reported last February that low volatility ETFs were failing to protect investors against sharp sell-offs.
It said: "instead of protecting UK investors against the sharp sell-off in US stocks this month [February], the three ETFs tracking low volatility versions of the S&P 500 index lost more than the mainstream index over some of the most volatile days."
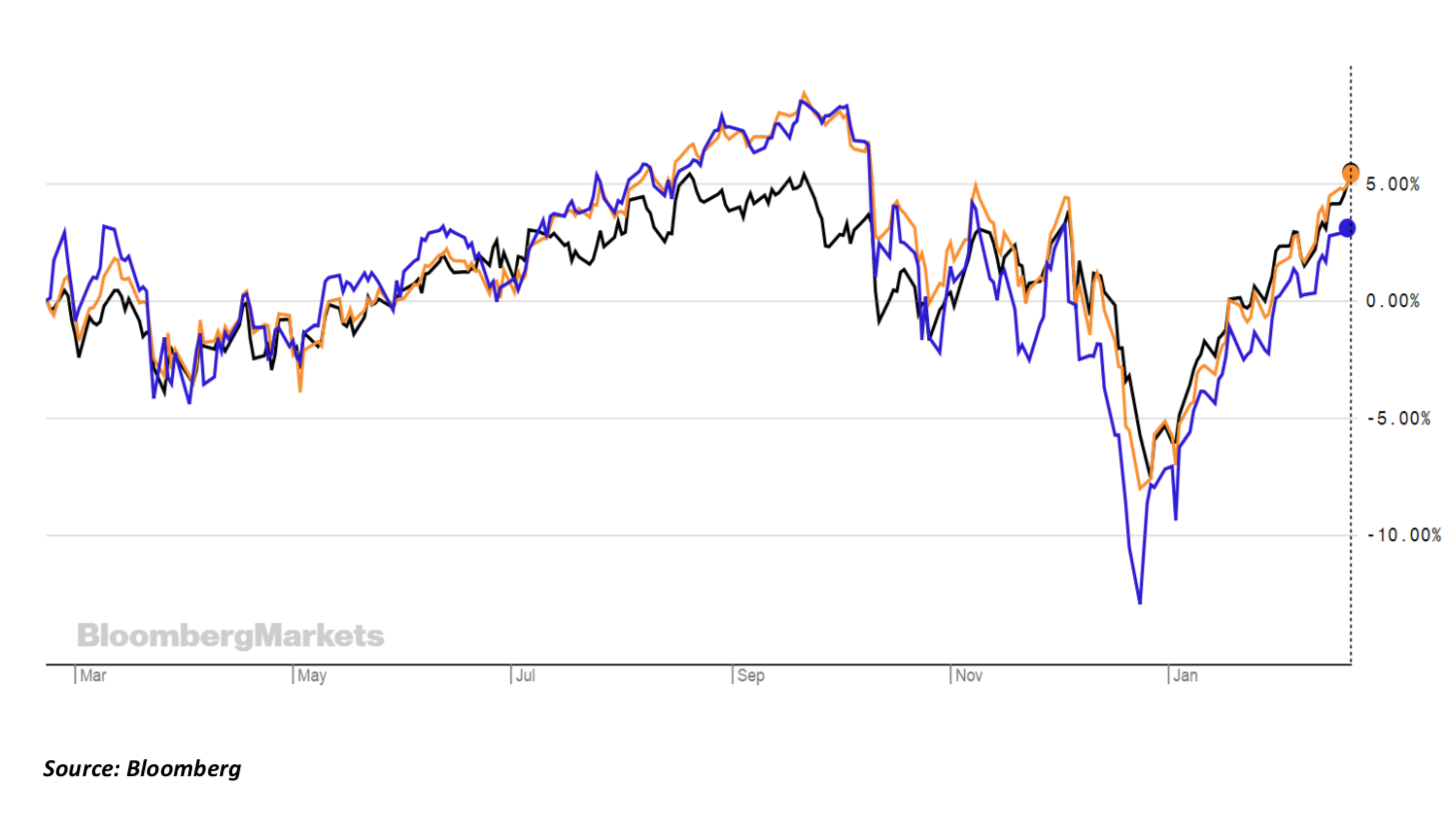
The seven days following 2nd February 2018 saw the S&P 500 index fall 2.9%. During this time the iShares Edge S&P 500 Minimum Volatility ETF (SPMV) lost 4.1%, State Street's SPDR S&P 500 Low Volatility ETF (LOWV) was down 4.4% in total return terms and the Invesco S&P 500 High Dividend Low Volatility UCITS ETF (HDLV) lost nearly 2%, according to the FT's note.
Below is a graph showing the performance of SPMV (in orange), HDLV (in black) and the S&P 500 Index (in purple) over the last year.

Despite this, minimum volatility style strategies have been the most popular smart beta strategies over the past couple of years, according to James McManus, Investment Manager, Head of ETF Research at Nutmeg. He says that they are the most popular. "This is as a result the bull market entering a historically long run and interest rates remaining subdued in most of the world."
The data also supports the theory.
According to December data from ETF research consultancy ETFGI, the iShares MSCI USA Minimum Volatility ETF (US) leads the smart beta ETFs by net new assets.
But, the real question is do they actually minimise volatility?
Sort of. Yes.
It helps to understand what's in them. While they might seem like they simply track an index with companies in that have low volatility, this isn't always the case and not every minimum volatility works in exactly the same way.
For example, the Invesco ETF HDLV is made up of securities from the S&P 500. It targets high-dividend-yielding stocks in the S&P 500 but keeps risk in check by filtering out some of the riskier names from this group and capping exposure to individual stocks.
In comparison, iShares' SPMV has 116 securities in the index which have the lowest absolute volatility of returns. The securities are chosen based on estimates of the risk profile and expected volatility of each constituent and the correlation between all constituents in the Parent Index.
The sector breakdowns of each fund are also very different.
HDLVs top five sectors in order of size are Real estate, utilities, energy, financials and consumer staples. This compares with SPMV which has IT, healthcare, industrials, consumer staples, and consumer discretionary as its top five.
The point is not every ETF will yield the same results and different strategies will react differently at different times. And there are supporters of minimum volatility ETFs who believe that it's a strategy best employed over the long term.
Nutmeg's McManus explains: "We don't think these products should be used for short-term exposures. Factor investing requires a longer-term time frame, and most experts agree that timing factors in the short-term is incredibly difficult.

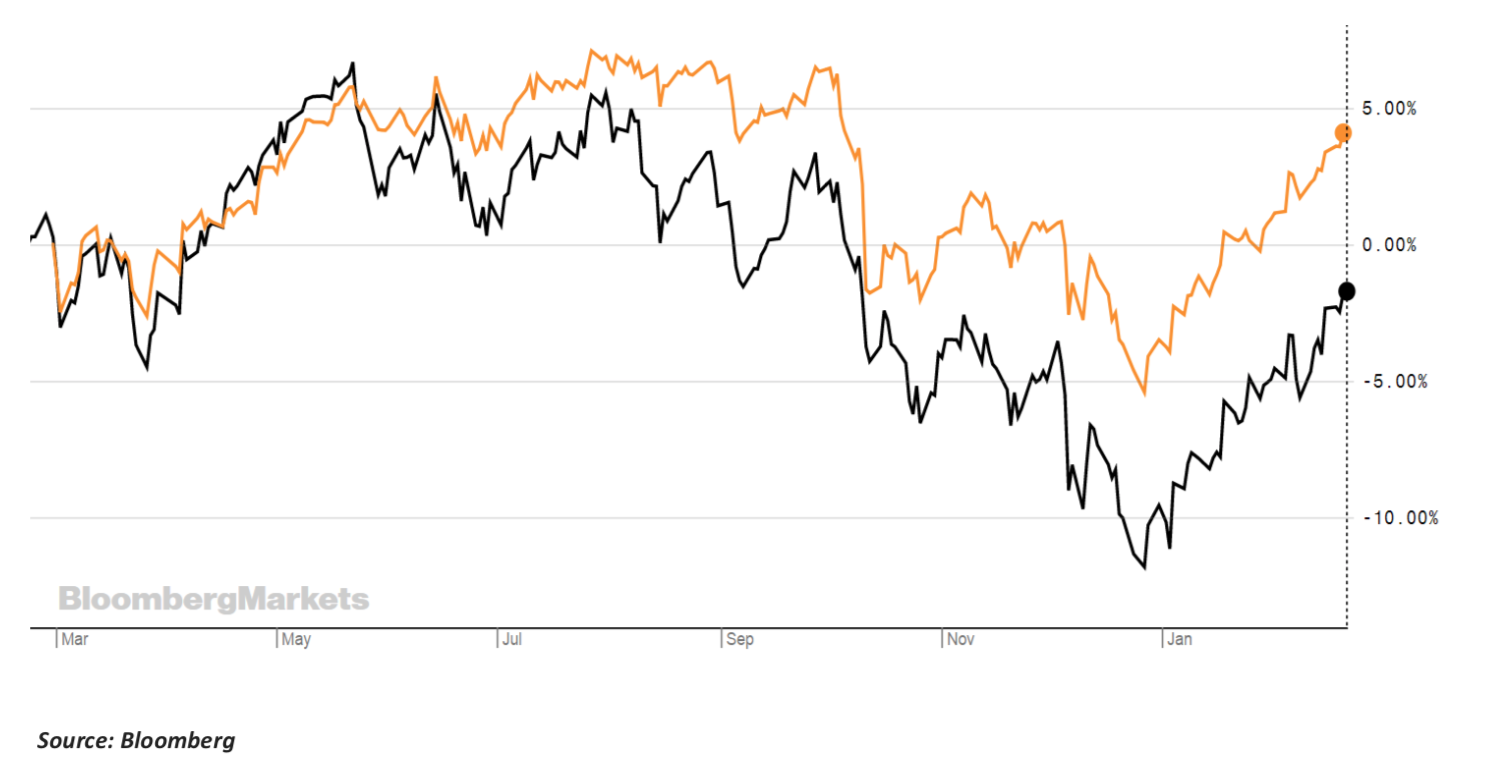
But there could be something in this. The graph above shows the iShares Core EURO STOXX 50 UCITS ETF (CSX5) in black against the iShares Edge MSCI Europe Minimum Volatility UCITS ETF (MVED). The graph only shows the term over a year - because that is how long MVED has been around for - but it suggests that there could be some truth in this long-term theory. CSX5 had negative returns of -1.99% over the past year compared to MVEDs 4% return.
So when are these strategies best used?
McManus suggests that it is critical investors acknowledge the prevailing market environment, and how this may affect their investment strategy.
"With the US Federal Reserve's interest rate normalisation well underway, we are concerned that the performance of low volatility strategies could be affected by rising interest rates. A 2016 study by Driessen, Kuiper and Beilo found that low volatility stocks benefit from having negative exposure to interest rates, and that interest rate moves explain up to 80% of unexplained excess return for low volatility. While only a short time frame, since the Fed began to raise rates at the end of 2015, the MSCI USA minimum volatility index has underperformed its market cap weighted equivalent. The MSCI US Minimum volatility has a lower exposure to the FAANG stocks and the technology sector that has been a large driver of US equity returns over previous years. Investors need to be aware of how this structural bias could impact them if this continues," he says.
McManus particularly likes the MSCI emerging markets minimum volatility approach because of the differentiated currency exposure it provides (often a large driver of lower drawdown in emerging markets).
"Minimum volatility across one country results in only stock differentiation, but across a region, such as emerging markets, results in both stock and currency differentiation," he says. However, he warns that investors shouldn't be of the view that these strategies provide a guaranteed solution to a complex problem - "volatility dynamics in markets change over time, and it's important to understand the strategies are weighted based on past volatility behaviour."
The key it seems is that different strategies are available for investors, it's just a case of knowing what you want, how it's going to work in the market you need it to, and what exactly is in the ETF.


