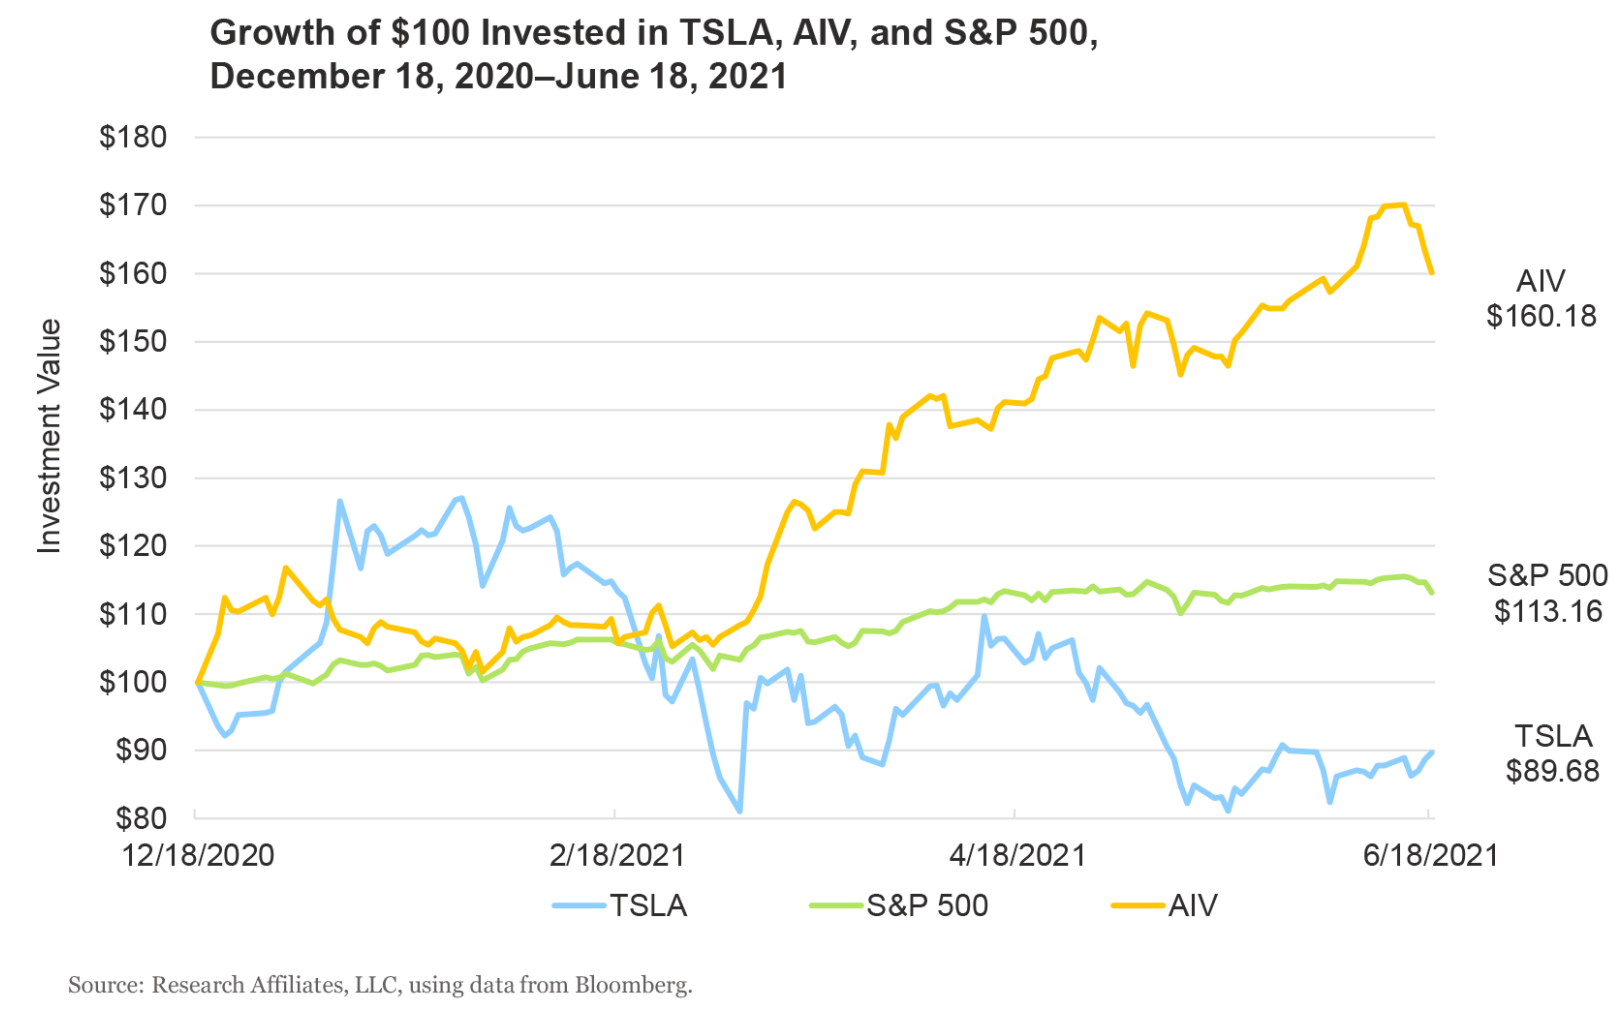
Following a bubbly rise that earned Tesla its spot in the S&P 500 index, the company has since underperformed its outgoing counterpart, Apartment Investment and Management (AIV), by 78%. However, this kind of event is more structural flaw than fluke, according to a report by Research Affiliates.
The report, titled Revisiting Tesla’s addition to the S&P 500, found additions and deletions from market cap-weighted benchmarks such as the S&P 500 behave in a dependable pattern following rebalances, with new arrivals underperforming and evictees outperforming over the subsequent 12-month period.
“Traditional cap-weighted indices routinely buy high and sell low when the index rebalances resulting in substantial hidden costs to investors who track the index,” the report warned. “The December 2020 S&P 500 rebalance out of AIV and into Tesla cost investors 41 basis points in the first six months, and the cost may go higher.”
Before the rebalance took effect last December, Tesla’s valuation was equal to the market cap of the nine largest automakers by sales volume – Toyota, Volkswagen, General Motors, Honda, SAIC, Hyundai-Kia, Ford, Fiat Chrysler and Renault-Nissan – with these companies accounting for 94% of global vehicle sales in 2020.
Despite this stark point of entry, ETFs, index funds and other S&P 500 trackers needed to buy $94bn of Tesla stock at its rebalance date valuation with the electric vehicle manufacturer’s share price having shot up 57% during the four weeks beforehand – since S&P Dow Jones Indices announced it would be joining the index.
This, the report said, was a striking confirmation of index tracking products’ propensity to buy high. It also illustrated their sell low tendency, with AIV falling 17% between its deletion being announced and implemented.
What really cements the point about inefficiency, though, is the fact AIV shares rallied 60% between 21 December and the report being published in June, while Tesla stock is down 10% over the same period.

“A pensioner with a $100,000 allocation to the S&P 500 is about $410 poorer as the result of the December 21 index rebalance,” the report added. “Unfortunately, this cost is totally unnoticed by investors because it is baked into the index’s performance.”
Inherent inefficiencies in cap-weighting
The research also highlighted how these kinds of losses have formed a motif over the longer term, with market cap-weighted indices tending to bias towards companies with high valuations versus both long-term fundamentals and sector averages. Conversely, undervalued stocks are more likely to be underweighted within these indices – and even the likely candidates for expulsion.
Furthermore, companies either side of market and sector norms often revert back to the mean as fundamentals catch up with prices over time and market cycles rotate back and forth.
“In an inefficient market, at least some of this mean reversion happens through the opposite dynamic as price reverts toward fundamentals,” the report continued. “This higgledy-piggledy tendency toward mean reversion produces a return drag on a cap-weighted portfolio relative to any strategy that does not link weight to price or to market cap.”
Equal weight ETF inflows surge as investors bet on cyclical shift
One consolation for index providers is that the stocks added at too high a price and those sold for too little have tended to represent about 2-4% of annual turnover. Even with a preventable 10% performance drag from a buy-high, sell-low scenario, the annual cost passed onto clients in indices such as the S&P 500 is usually between 20-40 basis points.
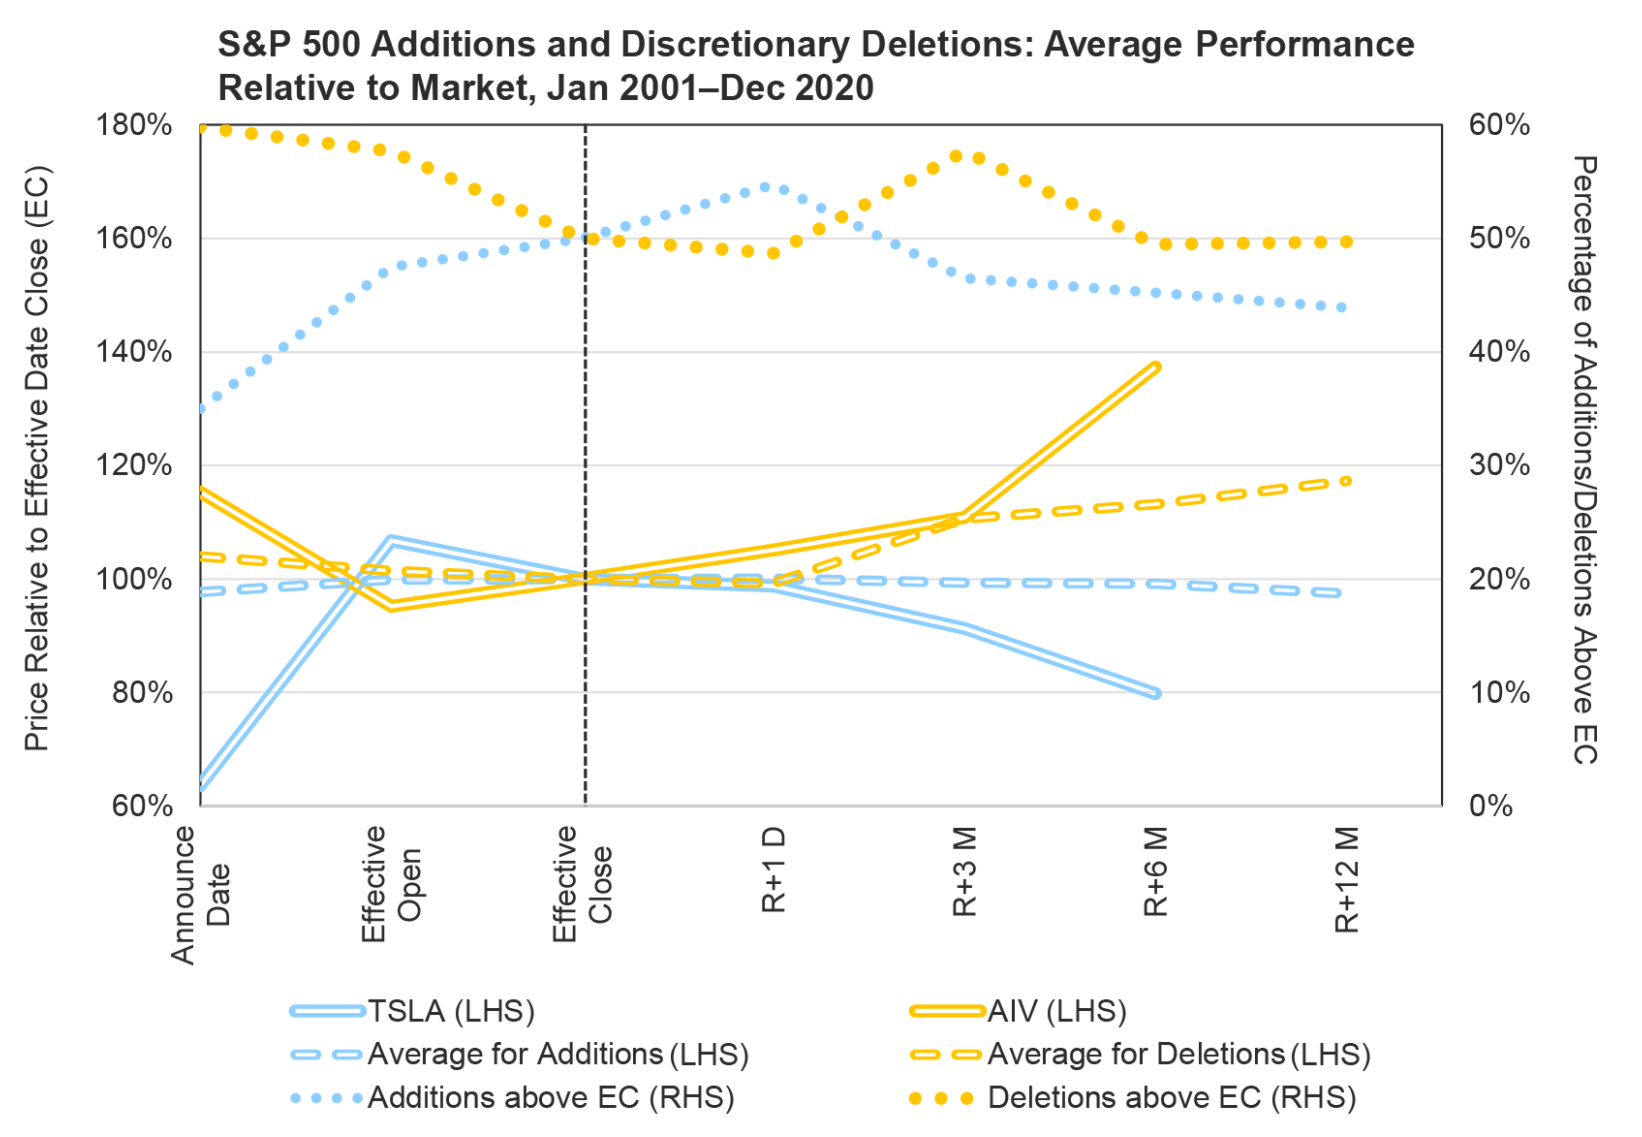
Illustrating the inefficiency of the rebalancing process, the report highlighted how, historically, only 35% of S&P 500 additions had a higher price on the day the index committee announced a stock would be added than the effective closing price on the day they are actually added.
Similarly, 60% of discretionary deletions saw their prices fall between their removal being announced and the effective date. The result of this is clear: over the past two decades, S&P 500 deletions have underperformed additions by an average of 6.2% between the market open on announcement day and market close on the date of the rebalance.
These performance trends then flip on their head after rebalance events, with Research Affiliates’ research showing only 43% of new additions finish their first year ahead of their effective closing price relative to the market, and the opposite being true for discretionary deletions.
The overall result of this being that during the first six months following a rebalance, the performance of additions tends to lag deletions by 14%, with this stretching to an average of 20% after 12 months.

Source: Research Affiliates
“The index rebalance is a great opportunity to do the opposite of what the index does: buy the deletion and sell the addition.
“Providing index investors liquidity and benefitting from the mean reversion of the price changes has historically proven to be an excellent investment idea,” the report continued. “Investors, as well as advisers and investment consultants, focus on the expense ratio of funds yet seem to ignore the flaws in the index process that easily cost them ten times the stated fees.
“These ‘hidden’ costs could be easily avoided with smarter index design and a more efficient approach to implementation.”


