Over the last 95 years (1926-2020), small cap US stocks have provided ample evidence that it belongs in a portfolio alongside large cap US stocks and US bonds.
In this study, the historical returns of the S&P 500 are used as the measurement of large cap US stocks. Small cap US stocks are represented by two indices: the Ibbotson Small Stock index from 1926-1978 and the Russell 2000 from 1979-2020. The performance of US bonds is represented by the SBBI US Intermediate Government Bond index from 1926-1975 and the Bloomberg Barclay’s Aggregate Bond index from 1976-2020.
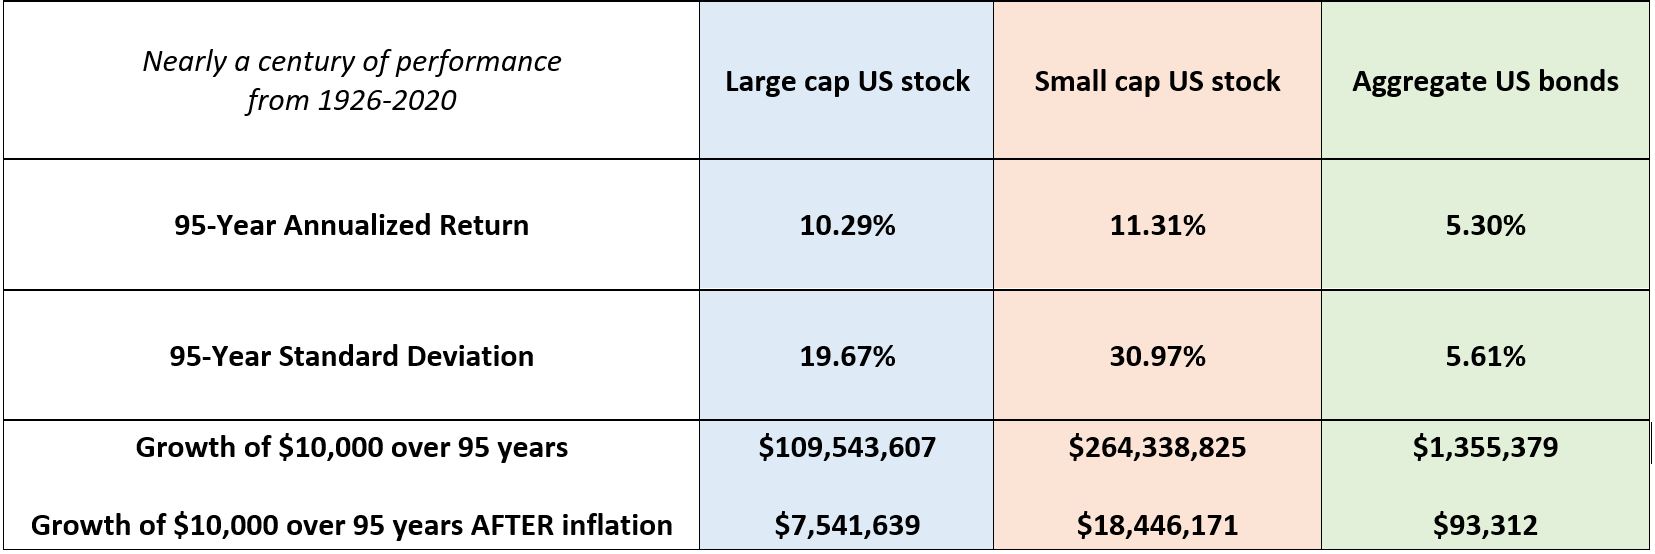
The 95-year return of large cap US stocks was 10.3% compared to 11.3% for small cap US stocks. Aggregate US bonds produced a 95-year average annualised return of 5.6%. An initial investment of $10,000 into each asset class resulted in dramatically different outcomes after 95 years. A 100% investment into bonds grew to $1.35m, compared to $109m in large US stocks and $264m in US small stocks.
Understandably, over such a long holding period, the growth of money is remarkably large. After accounting for CPI-based inflation each year, the net growth of a $10,000 investment in bonds was $93,312, $7.5m in large US stocks and $18.4m in small US stocks. Even after accounting for inflation, the final account values in large or small stock after 95 years are astounding.
Table 1: Nearly a century of performance

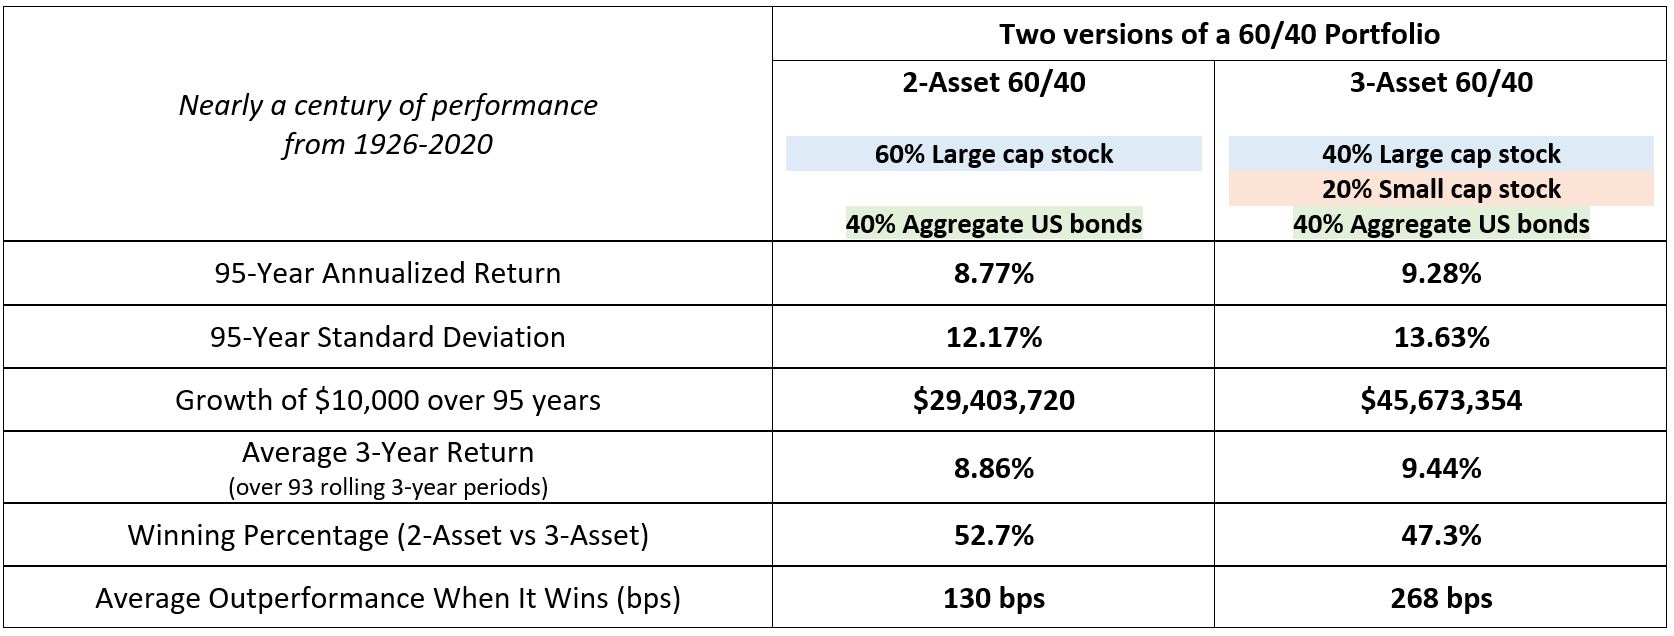
A more practical measurement of small cap stock performance is within the context of a multi-asset portfolio. Rather than a 100% allocation to small cap stocks (as shown above), small cap stocks were combined with large caps and bonds into an annually rebalanced 40/20/40 portfolio (40% large caps, 20% small caps and 40% bonds). The performance of this three-asset portfolio is compared against the “classic” balanced portfolio, which is 60% large cap U.S. stock and 40% bonds (see Table 2).
The classic two-asset 60/40 portfolio (no small stock allocation) had an average annualised return of 8.8% over the past 95 years, whereas a three-asset 60/40 portfolio that includes a 20% allocation to small caps had a 95-year return of 9.3%. The three-asset portfolio had slightly higher standard deviation, but practically speaking, the level of volatility of annual returns was comparable.
Perhaps a more valuable measure of performance is the average three-year return over the 95-year period (there were 93 rolling three-year periods between 1926-2020). The three-asset 60/40 model had an average three-year return of 9.4% versus 8.9% for the traditional two-asset 60/40 model.
Interestingly, the traditional 60/40 outperformed the three-asset 60/40 slightly more often (52.7% of the time). But when the three-asset model outperformed the two-asset model, it did so by more than twice as much (268 bps average outperformance for the three-asset model versus 130 bps average outperformance for the two-asset model). In other words, small caps add volatility to a portfolio – but primarily on the upside!
Table 2: Two versions of a 60/40 portfolio

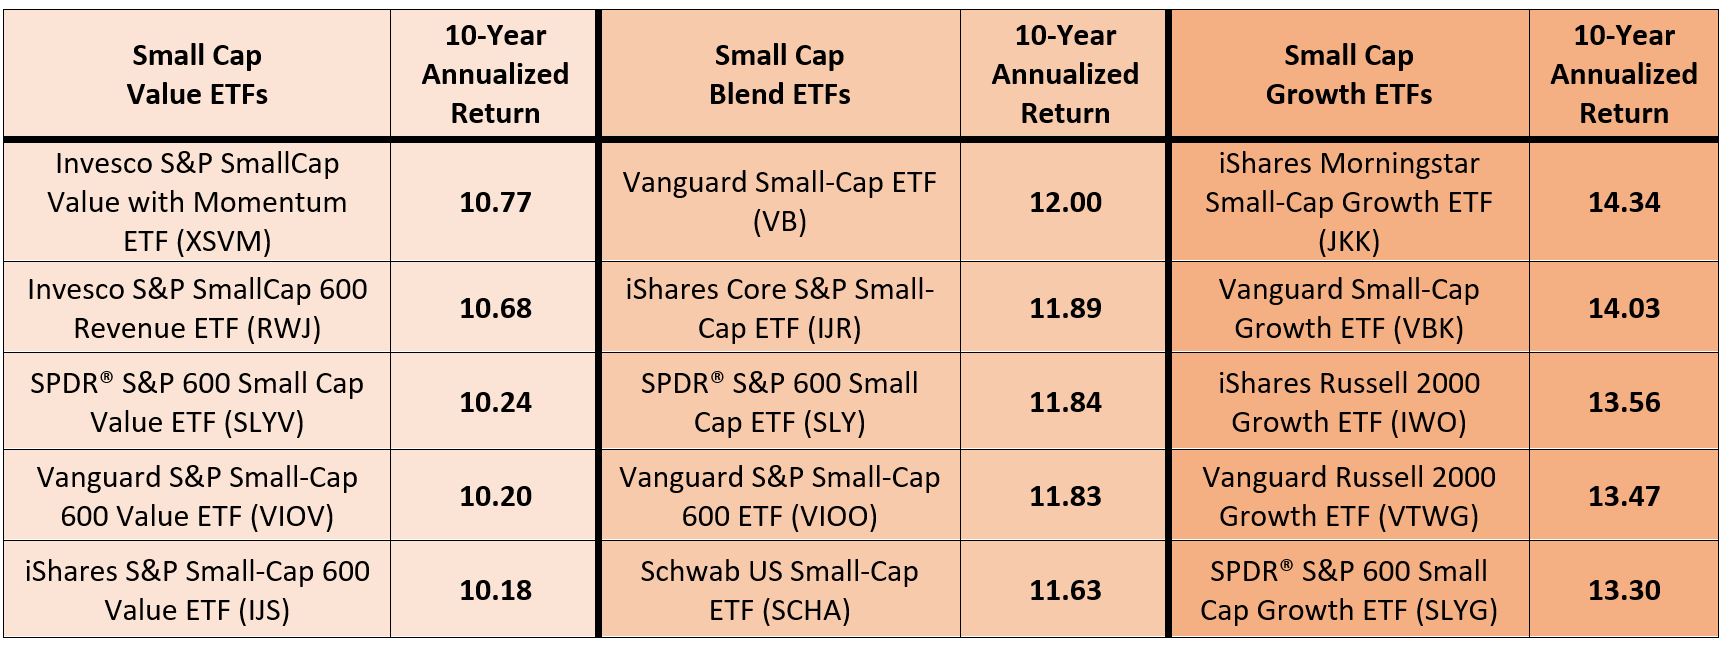
The top five small cap ETFs (value, blend and growth) over the past 10 years (January 2011 through December 2020) are highlighted in Table 3. It is interesting to note a distinct performance advantage in small cap growth over the past decade. Over longer time frames, we have seen the opposite; that is, a small cap value premium.
Table 3. Top five small cap ETFs over the past 10 years (2011-2020)

Craig Israelsen is the creator of the 7Twelve portfolio, consultant to 7Twelve Advisors, LLC and executive-in-residence in the Financial Planning Program at Utah Valley University
This story was originally published onETF.com


