Confusion about where inflation is heading has rarely been more widespread. Uncertainty has surged over the past 18 months as economists seem polarised. Are we experiencing a transitory surge in price levels or is a structural long-term rise on the cards? This debate has prompted a deluge of blogs and press articles.
The rush of interest is not surprising. Over many years we had got used to the Fed undershooting its 2% inflation target while investors have become accustomed to managing portfolios accordingly.
Market expectations are clear cut
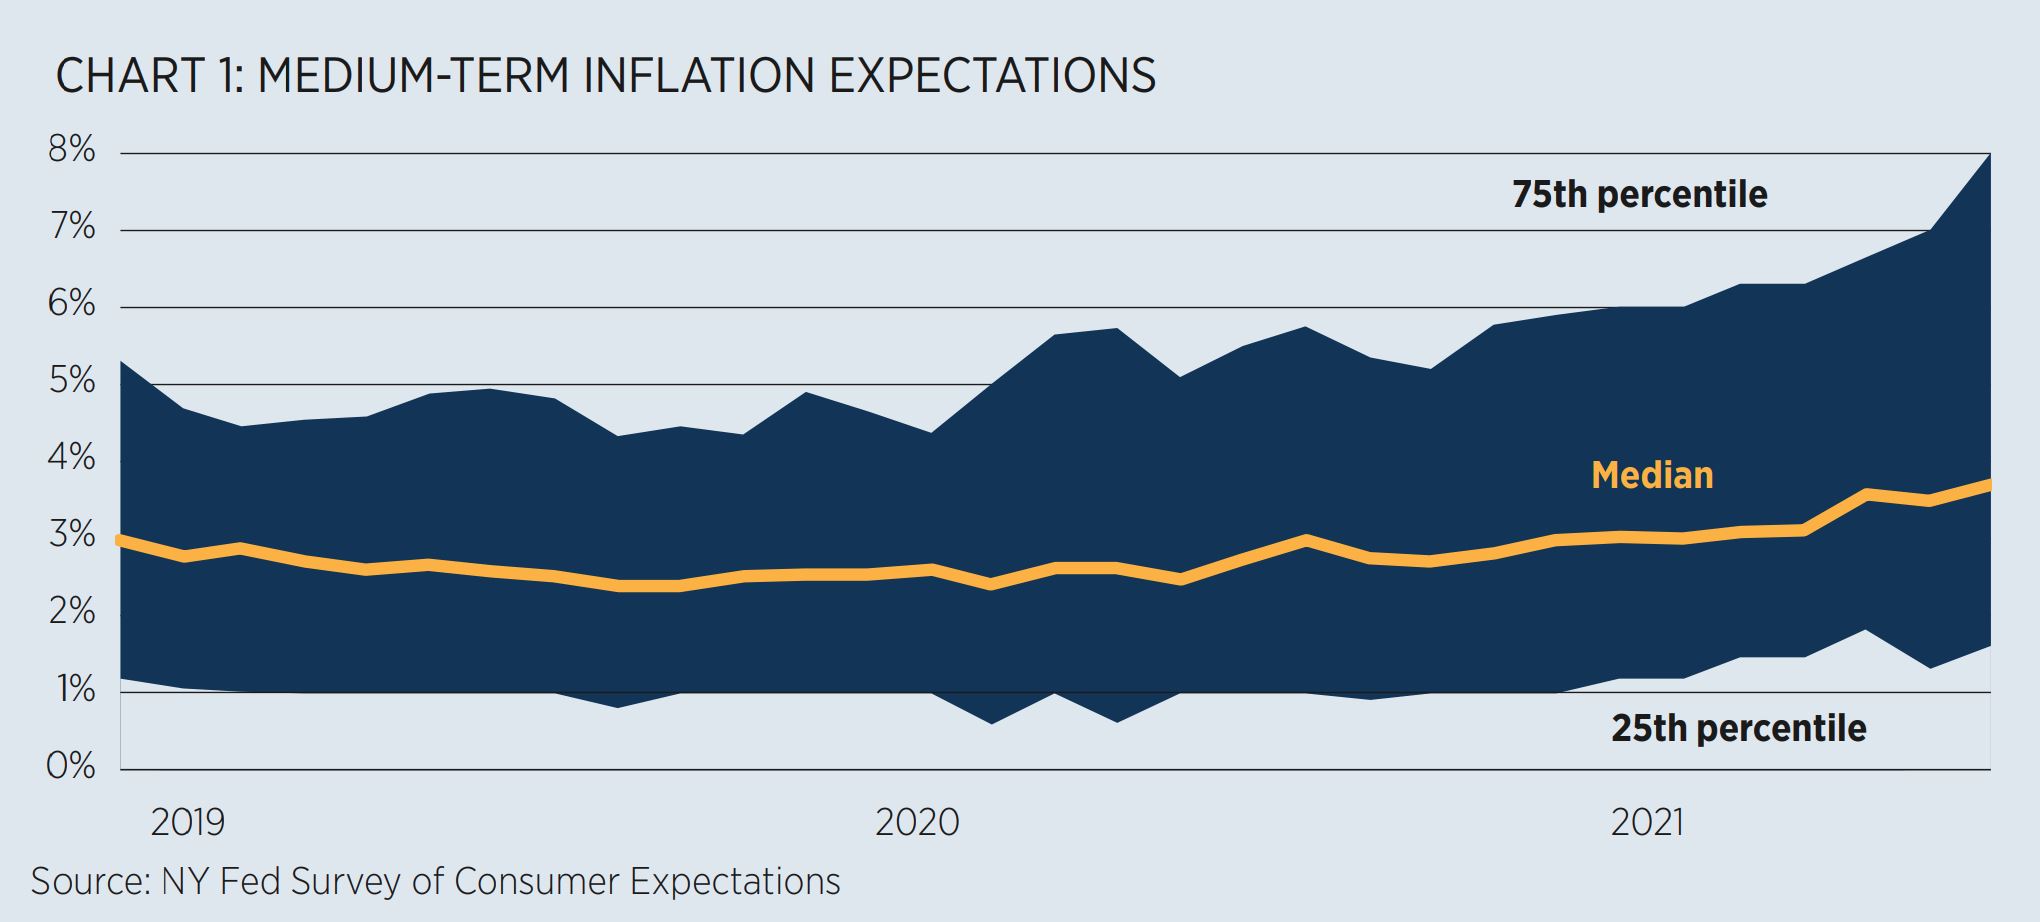
After US inflation surged 5.4% year-on-year in July, Consensus Economics now forecast US CPI to be no less than 5% for the remainder of the year. As recently as last summer the forecast for 2021 was only 1.7%. US consumer expectations for medium-term inflation also tell the same story. Expectations have both risen and diverged (see Chart 1).
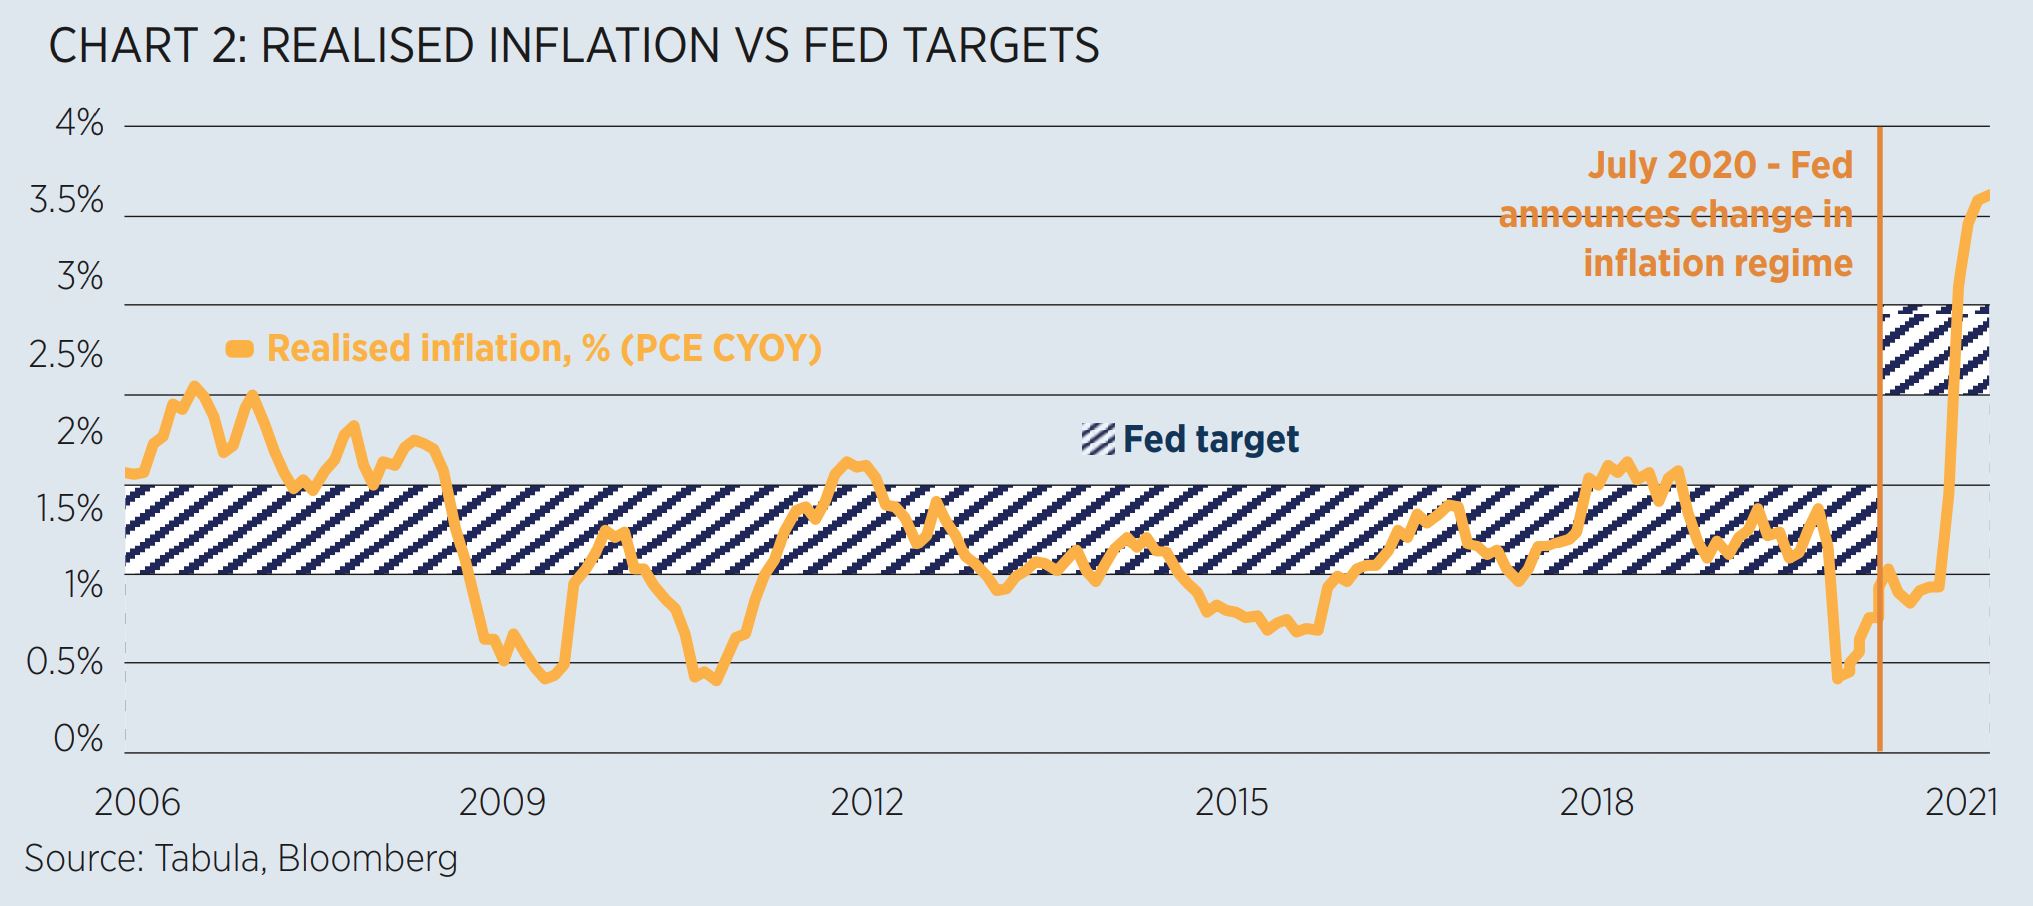
Realised inflation is ahead of the Fed's target
While realised inflation has appeared to level off, it continues to exceed the Fed’s long-term historic average of 2%, as well as exceeding the new implied target band of 2.5% to 3% (see Chart 2).
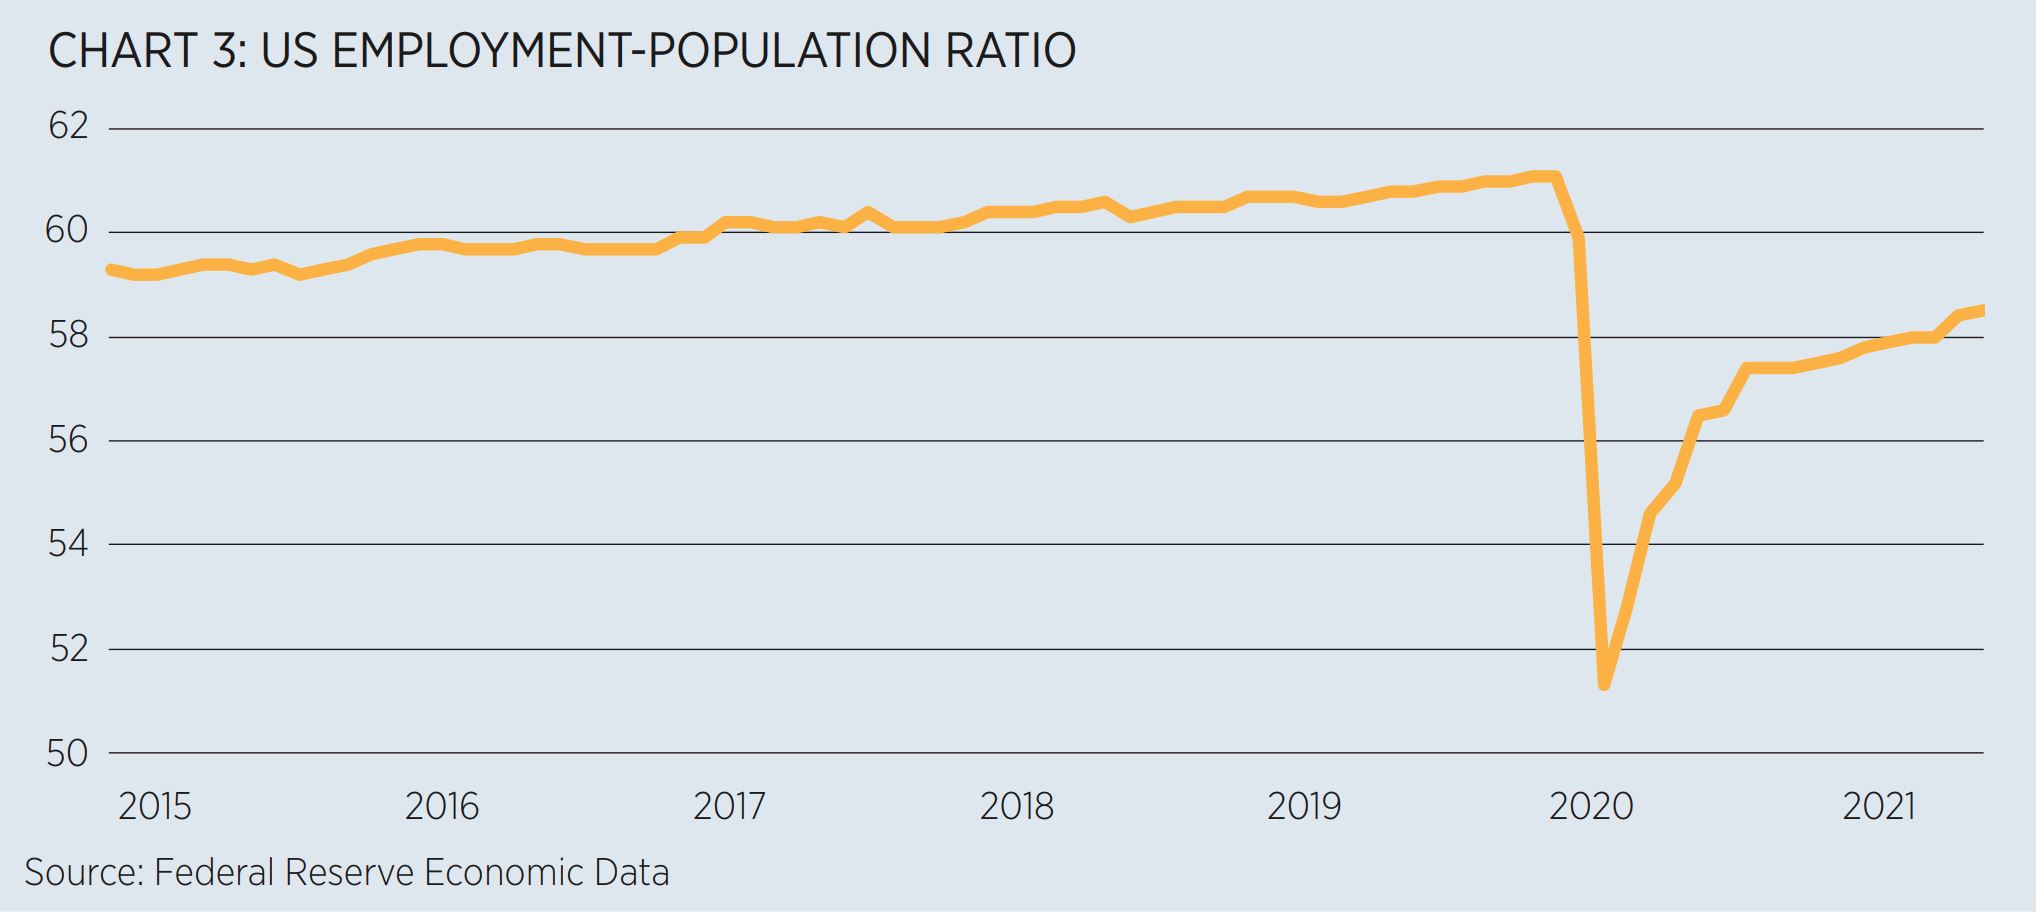
US employment remains below pre-pandemic levels
Many investors are watching the Fed closely, and the low inflation camp argue that tapering of post-pandemic stimulus and possible rate hikes will keep inflation “in check”. But the Fed’s rhetoric that inflation will be allowed to run hot until employment reaches pre-pandemic levels is unchanged. The pace of the recovery in employment-population ratio has slowed in recent months suggesting the Fed will not change course (see Chart 3).
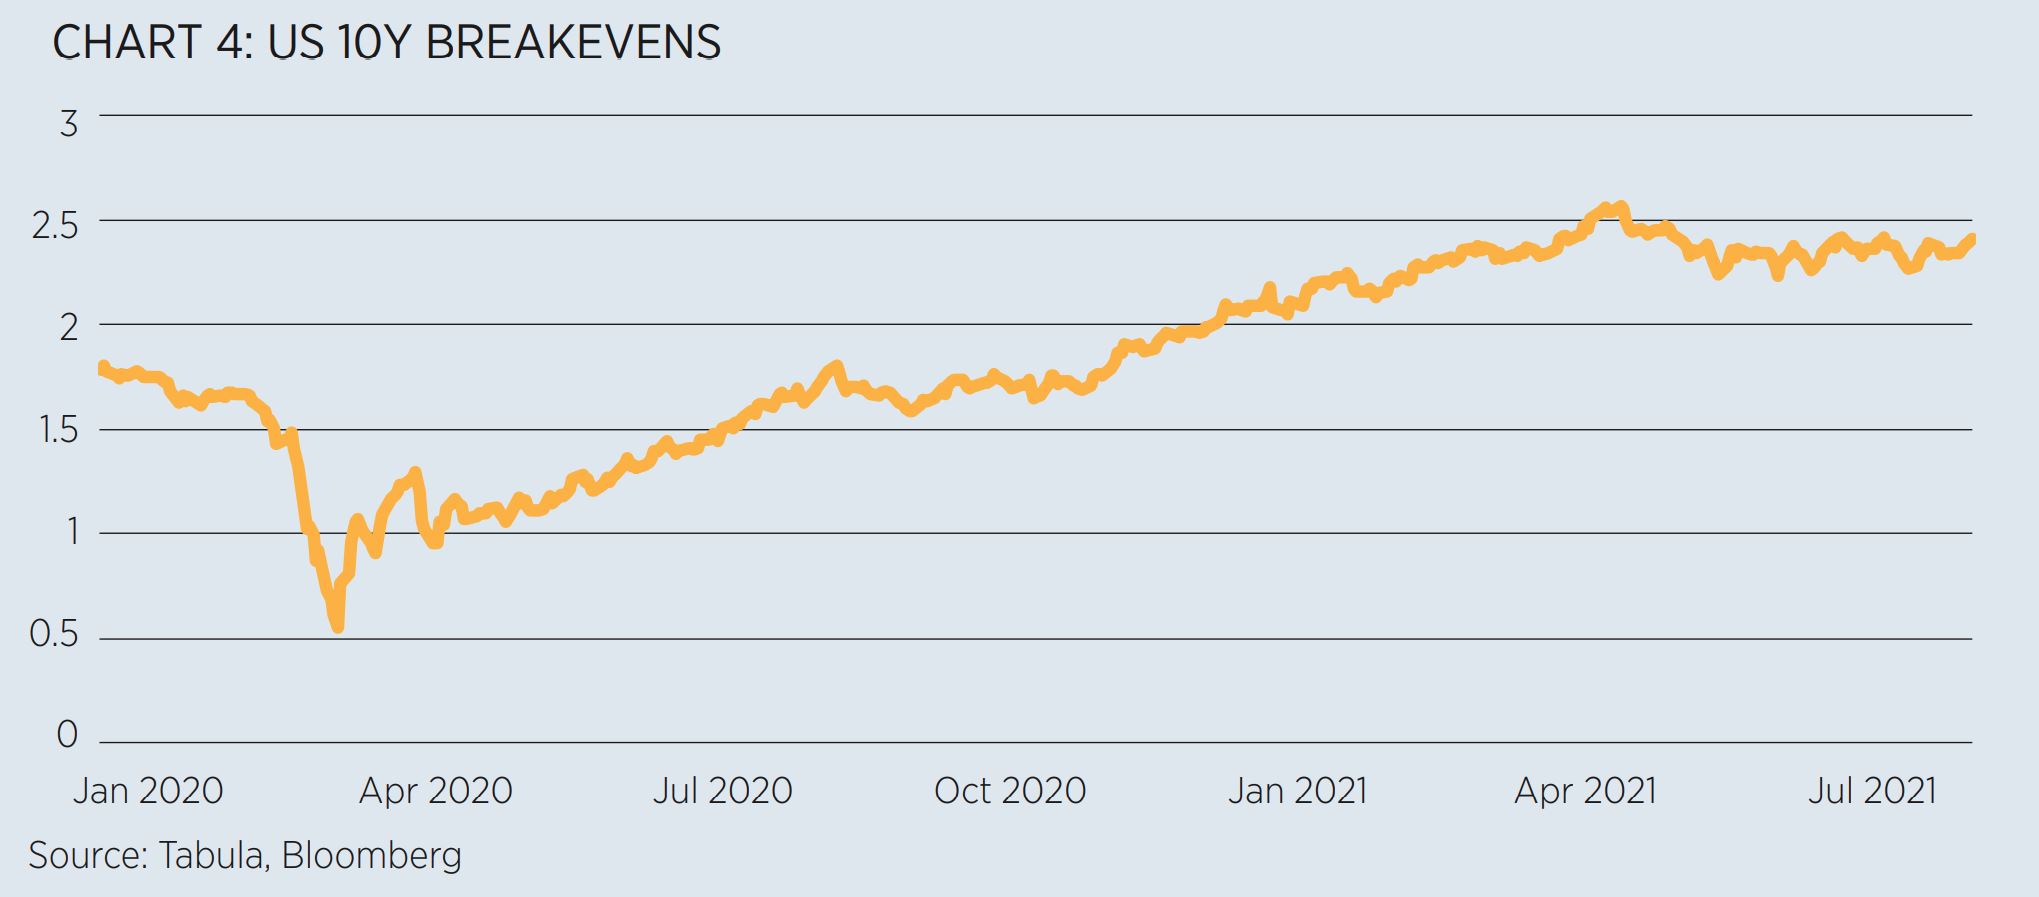
Breakevens take a breather
Since the beginning of the pandemic, US breakevens (the difference between the nominal yield and the real yield on Treasury Inflation Protected Securities (TIPS)) have been on a tear rising from a low of 0.6% in March 2020 to 2.6% in May 2021.
Since the summer, breakevens have pulled back from recent highs, offering an attractive entry point for investors who have missed out on the post-pandemic rally (see Chart 4).
European-domiciled inflation ETFs have seen a surge in demand
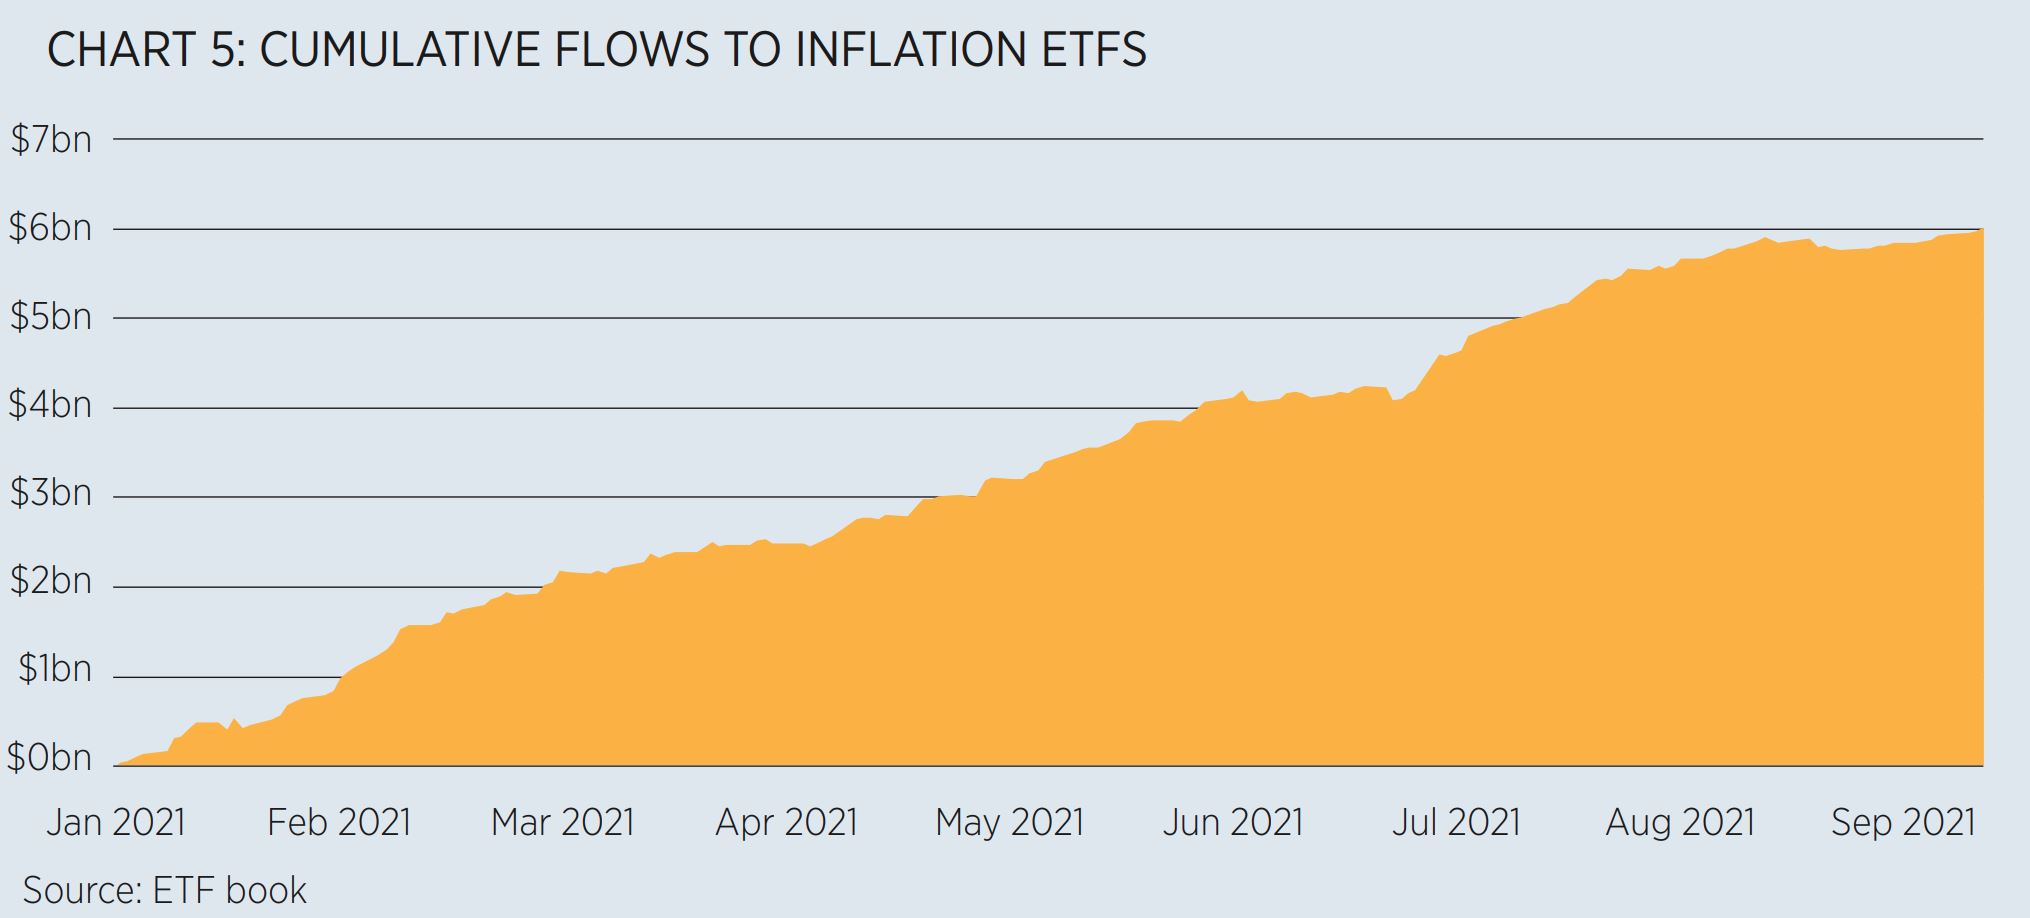
European-domiciled inflation ETFs have seen net inflows of more than $6bn this year, accounting for more than 20% of fixed income ETF net new assets in Europe (see Chart 5).
Factors that may lead to higher-for-longer inflation
The bounce back in inflation rates has caused consternation. The key question for investors is whether the bounce stops here or continues.
Investors should pay attention to the structural stories that might have a longer-term impact on inflation. There is compelling research suggesting that changes to global demographics had a moderating influence on inflation rates in the period from 1990 to 2020.
Economist Charles Goodhart and Manoj Pradhan argue that a reversal of that influence might be on the cards. Economists were caught out between 1990 and 2020 by the fact that local labour markets were starting to be influenced by global labour market dynamics. Goodhart and Pradham describe the growth of the global workforce in the 30 years from 1990 as the “single largest labour market supply boost in history”.
As this global workforce grew, liberalisation of trade allowed manufacturing companies to shift production to these low wage geographies. This had a dampening influence on global wages, especially in manufacturing industries, moderating both consumer price inflation and interest rates.
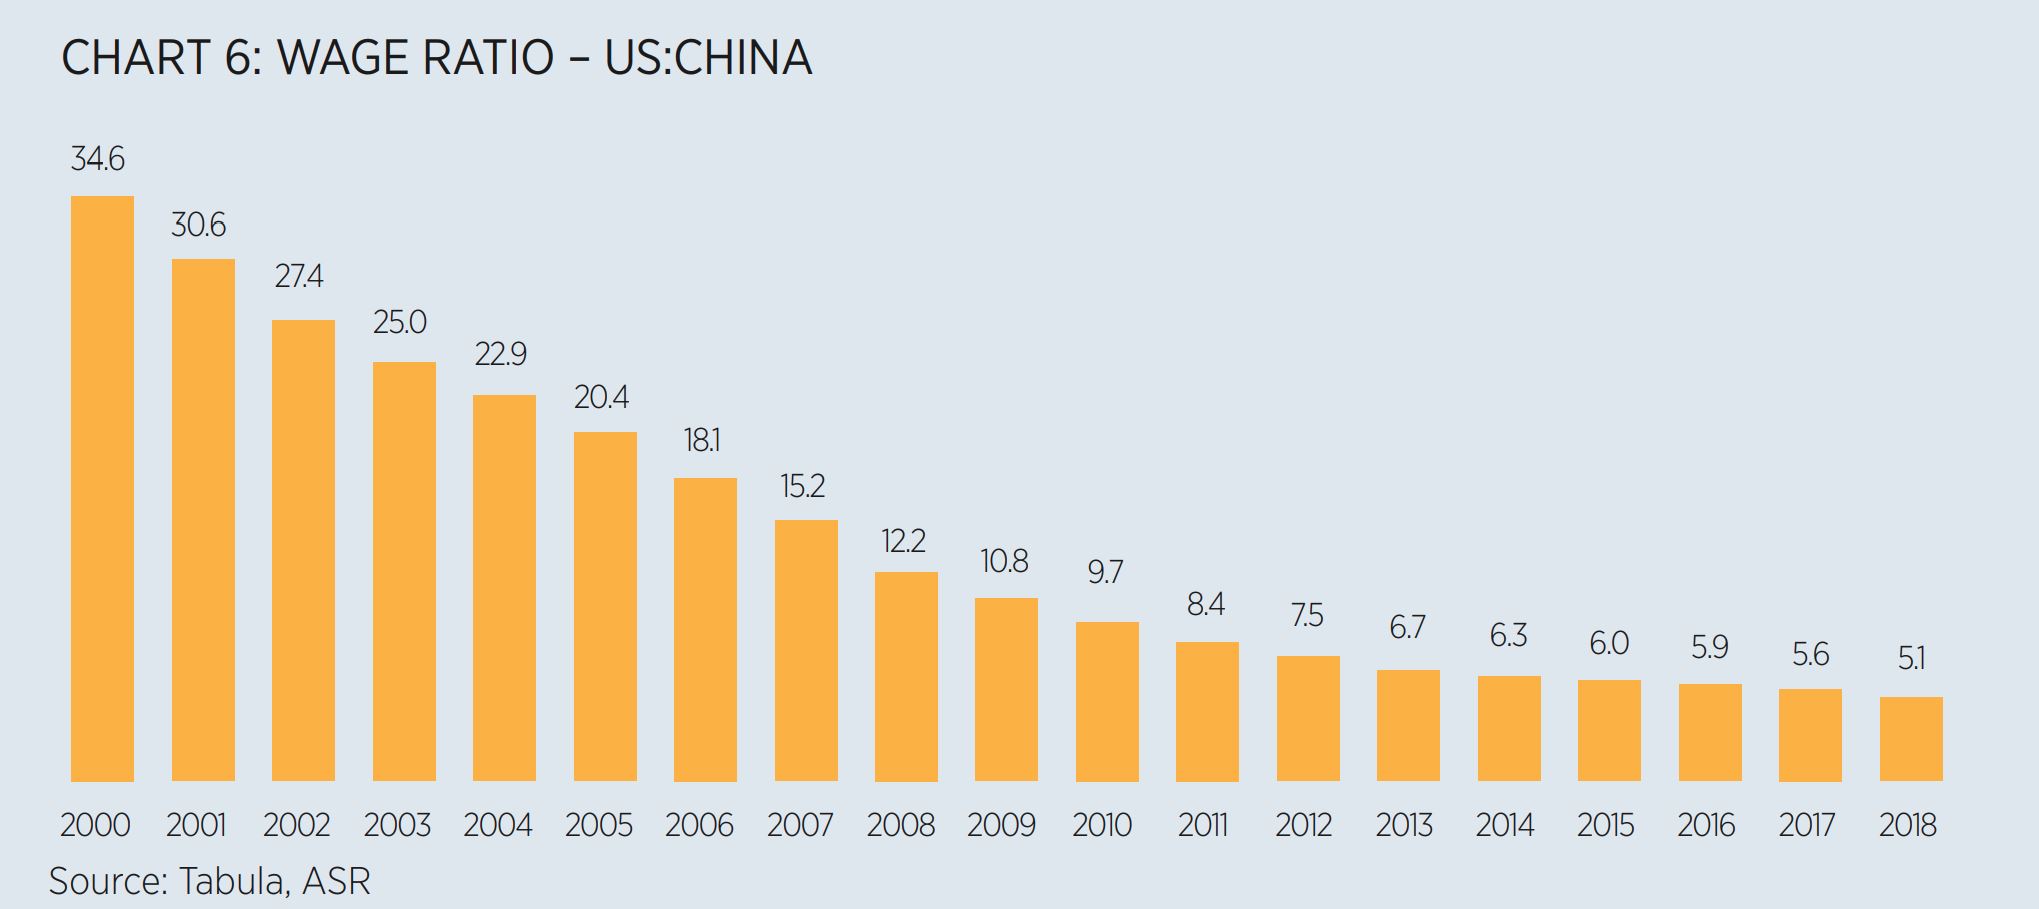
But over time, China has transitioned into a middle-income nation and since 2000 the US:China wage ratio has fallen from 1:35 to 1:5. The wages argument for outsourcing has weakened while at the same time, political pushback against globalisation and in favour of re-shoring (to the home nation) has grown stronger.
Wage ratio – US:China
Not only has the demographic sweet spot has now passed, but the effect could even go into reverse as working age populations start to shrink. The Chinese working age population has already peaked and will shrink at an even faster rate than in western nations, partly due to the lagged effect of the one child policy of the late 20th century (see Chart 6).
Working age population in millions (1950-2100)
Demographics do not usually play a role in investors’ considerations of where the inflation rate might go, because financial market forecasts are usually limited to a two-year rather than two-decade horizon, and fluctuations in the price of oil, food, rents etc. have a more immediate impact on the numbers. However, the experience of forecasters during the 1990-2020 period would argue that ignoring long term structural forces can be costly.
What to do if inflation is a possible future outcome?
It looks as though the long-running trend of stability in inflation rates is ending. The shift in the Fed policy target in 2020 was a significant event.
Comments from Fed chairman Jerome Powell have been unequivocal. Powell has clarified that the Fed will err on the side of allowing inflation rates to overshoot before enacting interest rate increases that might damage employment prospects. Traditional inflation ETFs force investors to choose between either realised inflation or inflation expectations. For many investors, both are important measures of inflation and a more efficient solution would be to combine them.
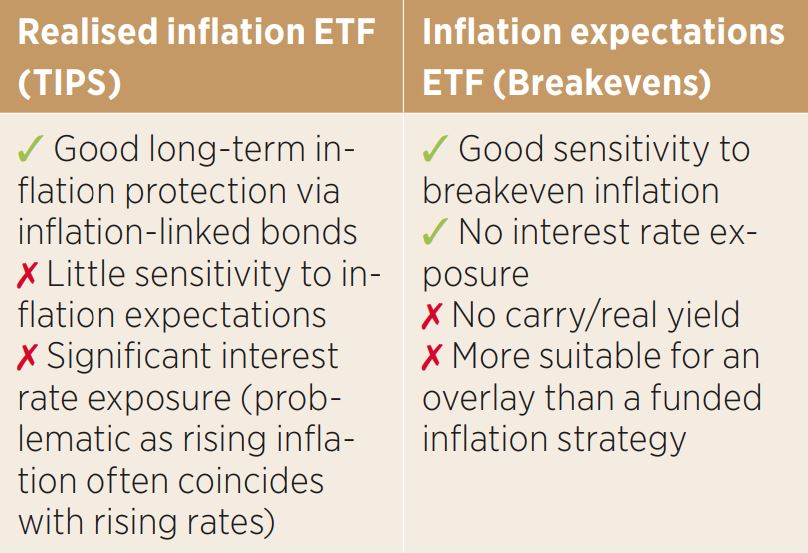
The Tabula US Enhanced Inflation UCITS ETF (TINF) combines exposure to a broad portfolio of US inflation-linked bonds (TIPS) and also acts as an efficient tool to capture US inflation expectations, in a single fund. TINF invests in a portfolio of US TIPS and OTC total return swaps which receive the return of the US breakeven inflation rate.
Jason Smith is CIO at Tabula Investment Management


