Oil posted its worst loss in two years last month amid concerns that a trade war will hit economic growth and energy demand will fall. Supply seems to be picking up too - crude oil inventories went on to rise last week and increases in production from OPEC and Russia suggest that supply levels could surge.
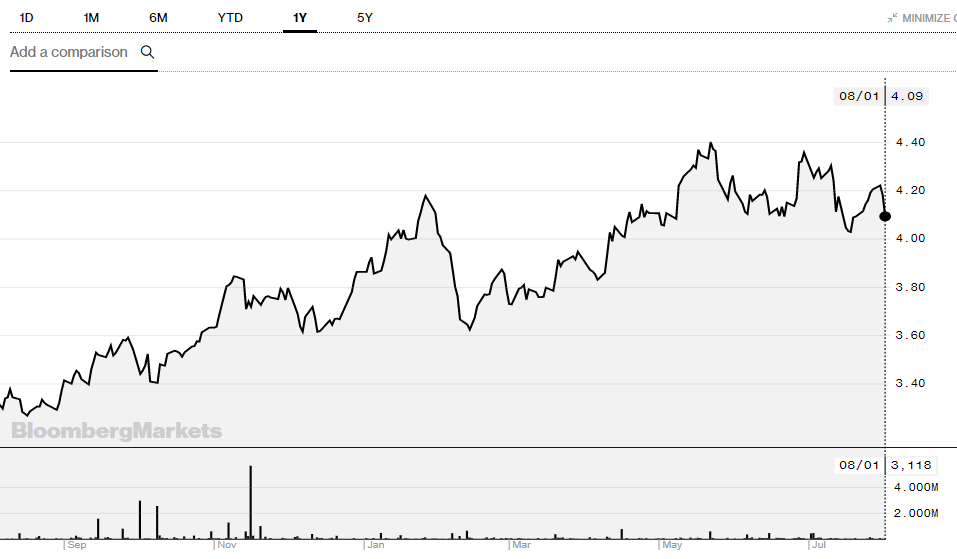
We've also seen some similar price action when you look at ETCs (exchange traded commodities.) For example, in the last month the ETF Securities Energy ETC (AIGE) fell by -4.5% to trade at around $4.09. Market watchers suggest that commodities are now reflecting the pressure from the threats of a trade war between the US and China.
However, commodities continue to be the best performing asset class this year, with oil leading the charge, and the energy complex has a number of supportive factors in its favour.
Oil is known for reacting to certain macro events. Recently when Saudi Arabia temporarily suspended all oil shipments through the Bab al-Mandeb Strait following attacks on two crude-carrying vessels by Houthi rebels in Yemen, the Brent oil benchmark experienced a stronger price reaction than the US-focused WTI oil benchmark.
ETF Securities reported that "close to 8% of global maritime oil trade goes through the Bab el-Mandab choke point (just under 5% of global oil and liquid fuels supply)….Most exports from the Persian Gulf destined to travel through the Suez Canal and SUMED pipeline (another important choke point), and eventually to the European markets, pass through the Bab elMandab. A diversion requires the oil tankers to travel around the Southern tip of Africa, adding to cost. That comes at a time when heavy crudes from Canada and Venezuela are also experiencing outages."
While AIGE may have dropped in the last month, last week marked the third consecutive week of inflows into energy ETCs, according to ETF Securities. It counts as the longest period of sustained inflows since June last year, with $8.6mn flowing in last week on the back of a 2.4% gain in oil prices. A note from the provider states that the outlook for oil now hinges on supply disruptions and that prolonged disruption could tighten supplies.
AIGE (below) has also returned 23.72% in the past year.
Source: Bloomberg
The chances of an upward trajectory in the energy complex continuing are also good. The World Bank has said that oil prices are expected to surge more than forecast and energy commodities - oil, natural gas, coal - are expected to jump 20% this year (a 16 percentage point uptick from their original forecast in April).
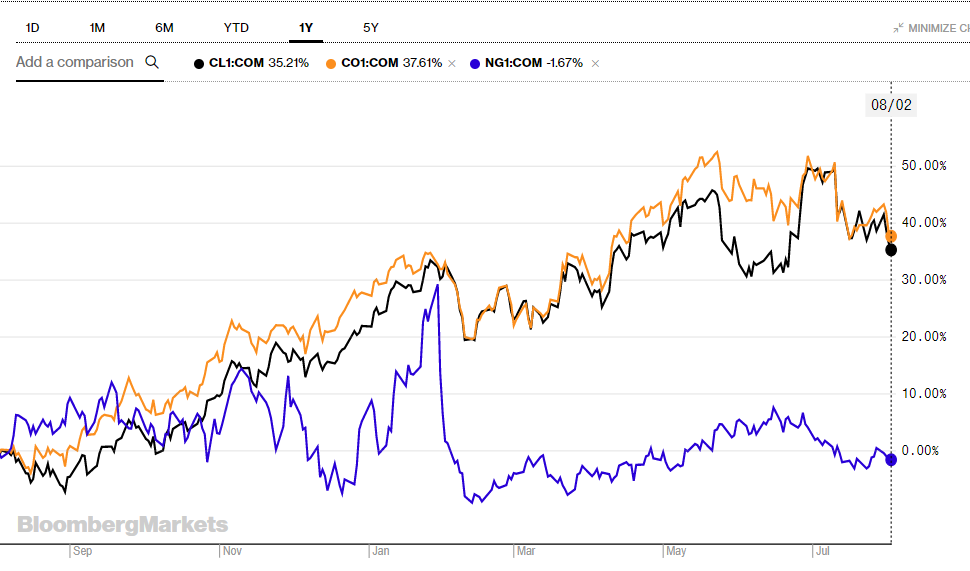
The graph below shows Brent Crude (CO1), WTI Crude (CL1) and Natural Gas (NG1).
Source: Bloomberg
A poll from Reuters also expects oil prices to remain steady for the remainder of this year and into next. The survey of 44 economists and analysts forecast Brent crude to average $72.87 a barrel in 2018, 29 cents higher than the $72.58 projected in the previous month's poll and above the $71.68 average so far this year."
This is on the back of increased output from OPEC and the US, which will help to meet growing demand from Asia and also offset supply disruptions from Iran and other countries.
OPEC reports that oil demand is expected to grow by 1.65mb/d this year. Next year, initial projections suggest a global increase of around 1.45mb/d. Demand is expected to be led by China and India. There will also be a steady acceleration in oil demand growth in Latin America and the Middle East.
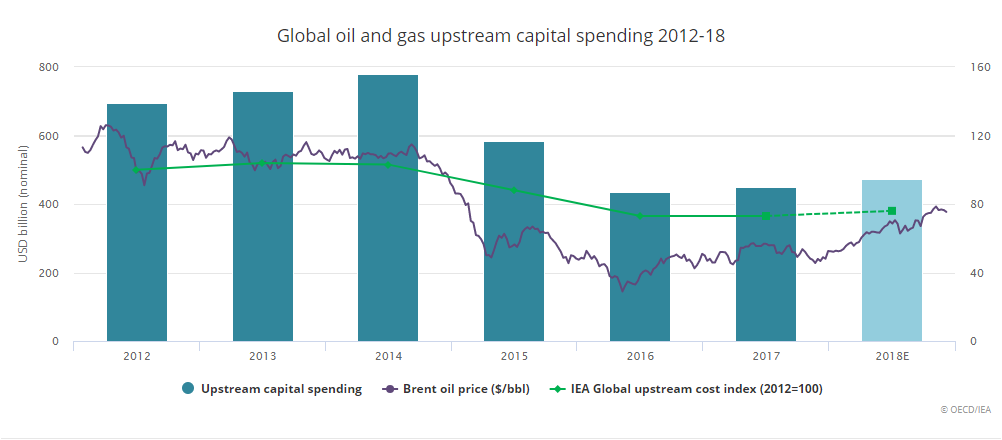
Within the oil complex there are also supportive factors as oil and gas firms do more with money invested. Investment in the energy oil complex peaked in 2014. For example, ENEF hit 40.99 in June 2014 - it's now trading at around 21.05. Following this spike prices dropped as did investment until 2017. Last year investment rebounded by 2% in real terms, according to the International Energy Agency (IEA), and it anticipates the same level of growth this year.
Source: IEA
The IEA reports: "One notable trend concerns the relationship between oil prices and upstream costs. In the past, there has been a roughly linear relationship between upstream costs and oil prices. When price spiked, so did costs, and vice versa. What we are noting now is a decoupling. While prices have more than doubled since 2016, global upstream costs have remained substantially flat and for 2018 we estimate those increasing very modestly, by just 3%. Companies appear to have learned to do more with less."
The LSE lists a number of energy ETFs and ETCs. These are listed below. ETCs differ from ETFs as they are UCITS eligible only and are typically physically backed by the commodity. In the cases of some of the ETCs below it is likely they are backed by contacts (fully funded swaps) with counterparties whose payment obligations are collateralised.
NAME
TER
1YR
RTN
INDEX
ETF/ETC
(SXLE)
Fee: 0.15%
Expense ratio: 0.30%
ETFS Longer Dated Energy (ENEF)0.49%27.41%Bloomberg Energy Subindex 3 Month Forward Total ReturnETCETFS Energy ETF (AIGE)0.49%23.72%Bloomberg Energy Total Return Index (previously DJ-UBSETCUBS ETC CMCI Energy USD (ENRU)0.38%36.72%UBS Bloomberg CMCI Energy USD Total ReturnETCUBS ETC CMCI Energy GBP (ENGB)0.50%34.02%UBS Bloomberg CMCI Energy GBP Monthly Hedged Total Return IndexETCETFS GBP DAILY HEDGED ENERGY (PENR)0.49%20.02%Bloomberg Energy Subindex Pound Sterling Hedged Daily Total ReturnETCETFS GBP Daily Hedged Longer Dated Energy (PFEN)0.49%24.94%Bloomberg Energy Subindex 3 Month Forward Pound Sterling Hedged Daily TRETCiShares S&P 500 Energy Sector UCITS ETF USD Acc (IUES)0.15%17.38%S&P 500 Energy IndexETFAmundi ETF MSCI Europe Energy UCITS ETF (ANRJ)0.25%27.83%MSCI Europe Energy IndexETFInvesco Energy S&P US Select Sector UCITS ETF (XLES)0.14%18.54%S&P Select Sector Capped 20% (Energy) Net Total Return IndexETFiShares Global Clean Energy UCITS ETF USD Dist (INRG)0.65%3.27%S&P Global Clean Energy IndexETFL&G US Energy Infrastructure MLP UCITS ETF (MLPI)0.25%-8.10%Solactive US Energy Infrastructure MLP Index TRETFLyxor MSCI World Energy TR UCITS ETF (NRGW)0.30%19.51%MSCI World Energy TRN index.ETFSPDR S&P U.S. Energy Select Sector UCITS ETF0.15%17.43%The ETF tracks the performance of large sized U.S. energy companies in the S&P 500 IndexETFSPDR MSCI World Energy UCITS ETF (WNRG)0.30%19.72%MSCI World Energy indexETFSPDR MSCI Europe Energy UCITS ETF (ENGY)0.30%28.16%MSCI Europe Energy 35/20 Capped IndexETFXtrackers MSCI World Energy UCITS ETF (XDWO)Management19.45%MSCI World Energy Net Total Return IndexETF
