Fixed income ETFs enter 2024 on the back of a record year of asset gathering in Europe, however, the wait for their breakthrough moment owes just as much to decades of technical and intellectual hurdles as the well-documented macro headwinds.
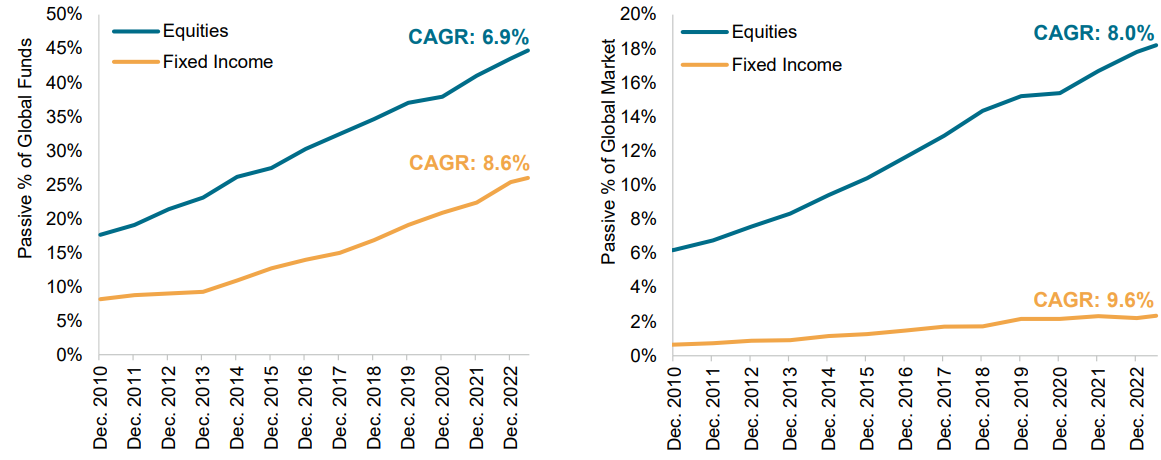
A recent paper from S&P Dow Jones Indices (SPDJI), titled The Hare and the Tortoise, suggested a “similar revolution” is primed to play out in index-tracking bond strategies as the one in passive equity funds over recent decades.
In fact, the index provider noted the passive story in fixed income markets is now on a similar trajectory to that of equities more than a decade ago, albeit with a higher growth rate.
Chart 1: Trends in passive global mutual fund and ETF assets

Source: SPDJI
However, passive fixed income’s road from initial benchmarks to ETF proliferation has been littered with additional complexities.
SPDJI said index equity funds first saw action in the early 1970s, with the first equity ETF coming to market in 1993. In fixed income, meanwhile, the first fund launched in 1986 and the first ETF did not arrive until 2002.
“Bond index funds came later for both practical and theoretical reasons,” the index provider said.
“In practical terms, it generally was and remains harder to replicate a bond index than an equity index. Further, although there are many theoretical arguments that apply to both bonds and stocks, the case for active investing in the two asset classes has important differences.”
Fixed income walked while equities ran
A first hurdle SPDJI outlined was the lack of readily available fixed income benchmarks while equity funds were already in the field.
In fact, it noted the first bond indices were conceived almost a century after the first equity indices, with the first iteration of what became the S&P 500 dating back to 1923, whereas the first bond indices were created in the same year as the launch of the first S&P 500 fund – 1973 – by investment banks Salomon Brothers and Kuhn, Loeb & Co.
Furthermore, equity indices were also “traditionally the property of media and publishing houses” while fixed income benchmarks were initially maintained by brokerage houses to facilitate trading by market participants.
It was not until these benchmarks were acquired from trading desks by data providers – such as Kuhn Loeb’s suite to Bloomberg and the iBoxx range to SPDJI – that the range of available indices and passive trackers increased.
Another hurdle is the additional complexity involved in replicating fixed income benchmarks versus equity indices.
For instance, while SPDJI’s headline equity benchmark is comprised of 500 stocks, the firm’s index of corporate bonds issued by the same companies contains more than 6,000 issuances.
Additionally, the cost of buying a single bond is typically “much more” than a single equity, with fixed income index tracking strategies also tending to require more maintenance to account for bonds maturing, defaults, changes in credit ratings and new issuances.
“In quantitative terms, the amount of trading required might be 10 times that in equities,” SPDJI continued. “All of which means that it is harder in practice to build and maintain a broad-based index-tracking bond portfolio.”
While it is standard practice for portfolio managers to implement a ‘sampling’ methodology – and ETF liquidity providers to optimise their inventories – the technical and technological capabilities to facilitate this contribute to passive fixed income’s delayed start to life.
Late start, slow uptake
Also contributing to the lag in traction for passive fixed income funds and ETFs was the lack of data illustrating their merits, as had been available for equity index funds for decades.
SPDJI noted its infamous SPIVA scorecards previously did not report on fixed income, partially because of the lack of available benchmarks.
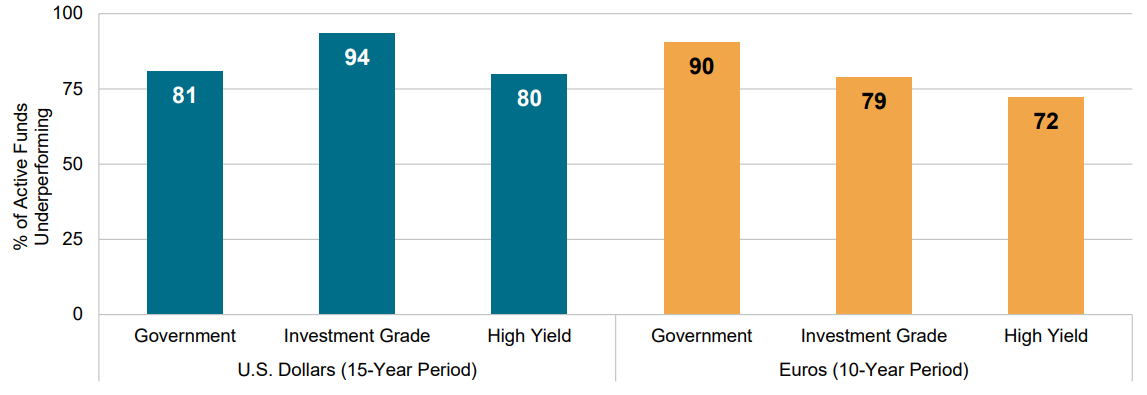
The subsequent proliferation of fixed income indices and low-cost trackers has enabled SPDJI and others to illustrate that no fewer than 72% of active fixed income funds have underperformed their benchmarks over 10 and 15-year periods across US dollar and euro sovereigns, investment grade and high yield credit categories.
Chart 2: Long-term US and European active fixed income underperformance

Source: SPDJI
Interestingly – making up for lost time – passive bond strategies were not confined to the largest and most liquid exposures in their early days. Instead, fixed income ETFs first broke ground in Europe with euro corporate bond ETFs from Barclays Global Investors (GBI) in 2003.
Concluding, SPDJI compared the position of passive fixed income at the end of 2023 to equities in 2012.
By the end of last year, passive bond funds and ETFs housed $3.2trn across 4113 products globally, comprising 2.3% of the total market. This compares to $2.7trn across 5162 products comprising 7.6% of the total market for equity passives more than a decade ago.
However, over a medium-term horizon, continued momentum in fixed income will continue to be influenced, if not defined, by the monetary policy backdrop. Bond ETFs claimed 37.5% of all European exchange-traded product (ETP) inflows last year – well above their 25% market share at the beginning of 2023 – but maintaining this form will depend on investors continuing to lean into the 'bonds are back’ narrative.


