Vincent Deluard, global macro strategist at INTL FCStone, studies six million data points to answer the simple question of an important topic that receives relatively little attention, whether ETF flows impact short-term performance.
Introduction
Over the past months, I completed a tedious study involving about six million data points to answer a simple question that many of our clients have asked. Do ETF flows matter for short-term performance? ETFs are bought (and sold) because they provide exposure to broad market movements. But could the reverse be true? Do large ETF outflows create disruptions in the price of their underlying baskets? Does the tail sometimes wag the dog?
The first part will present the data and outline a first important finding: ETF flows are more than just random noise. ETF flows display serial correlation, i.e. large outflow days are likely to be followed by more selling, even though performance tends to rebound the day following large redemptions.
The second part will focus on the impact of large redemptions on the normal arbitrage relation between ETFs’ market price and the net asset value of their assets. Large outflows do not cause abnormal deviations from net asset value for the largest equity and bond funds, including HYG (iShares iBoxx High Yield Corporate Bond ETF).
However, large outflows can lead to significant discounts-to-NAV for smaller high-yield bond funds, leveraged loan ETFs, high-yield muni ETFs and emerging markets debt ETFs. Asia equity ETFs trade at very wide discounts to their NAVs on large outflow days, but the mispricing may partly be explained by time zone differences and the use of stale data in NAV calculations.
The third part will show that large redemptions for smaller emerging markets funds, where dealers cannot properly hedge their exposure due to liquidity issues or trading constraints, lead to abnormally large losses and discounts to NAVs. These effects are typically reversed the following day, rewarding the brave investors who are willing to assume risk when the ETF crowd bails out.
Overview of ETF panic attacks
I studied daily flows, assets, prices, and net asset value for the 1,000 largest US-listed ETFs since January 2014, or about six million data points. I defined a big outflow as a net redemption of more than 2% of outstanding assets, which corresponds to a sale of $6.2 billion for the largest ETF (SPY) and about $4.5 million for a relatively small ETF like EPHE (iShares MSCI Philippines ETF).
A major issue with ETF flows is that all outflows do not correspond to actual selling. For example, big US equity ETFs, such as SPY, IWM, QQQ, and DIA, are often used to temporarily park money when futures and options contracts are rolled over. Rebalancing can also lead to large technical creations or redemptions. Typically, these flows are reversed within a few days. Because these technical redemptions create a lot of white noise in the flow time series, I only considered outflows which were not preceded or followed by a large creation in the same week.
Large redemptions are generally more frequent among the largest, most active ETFs although some very large ETFs never experience large redemptions. For example, the third largest ETF in the world, VTI (Vanguard Total Stock Market ETF) never experienced an outflow of more than 2% of its assets (see graph 1).

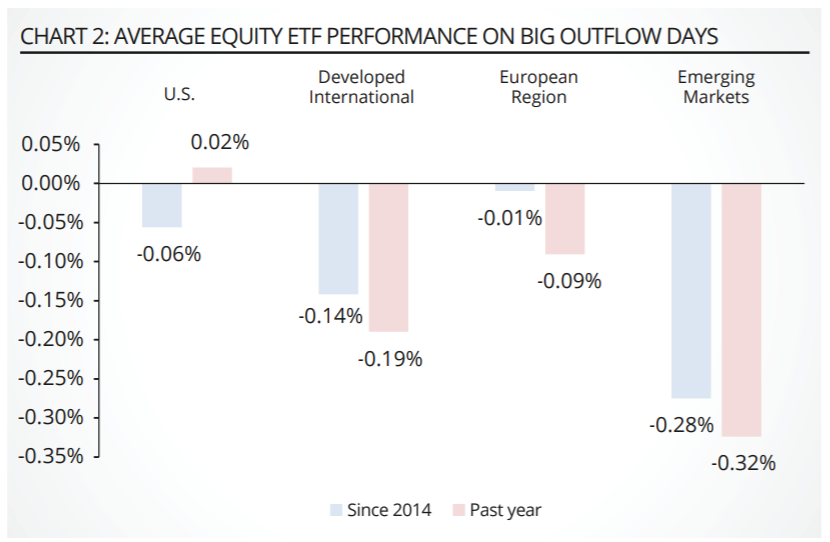
Studying the relation between flows and returns is a bit of chicken and egg conundrum. Investors might sell because of market losses, and their sales might cause the underlying basket to lose value. Indeed, average ETF performance has been negative on big outflow days for international and emerging markets ETFs. That effect is not observed among US equity ETFs, partly because of their greater liquidity and the prevalence of technical/ arbitrage-driven trading (see graph 2).
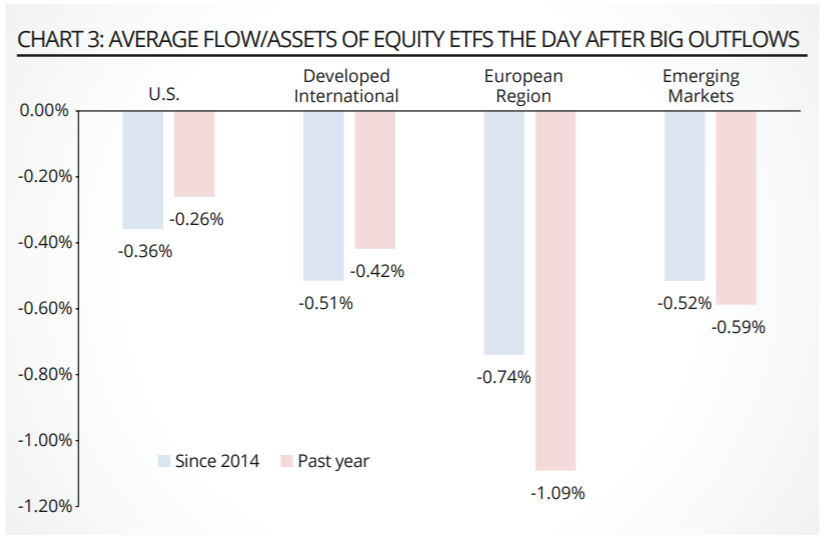
Looking at flows the day following large redemptions may help disentangle the feedback loop between flows and returns. In general, outflows tend to carry over the following day. For example, the average Europe equity ETF has lost an additional 0.7% of its assets after days when it had posted redemptions of more than 2% of its assets. Outflows from US equity ETFs are much less persistent, which is consistent with the fact that flows are primarily driven by arbitrage and technical factors (see graph 3).
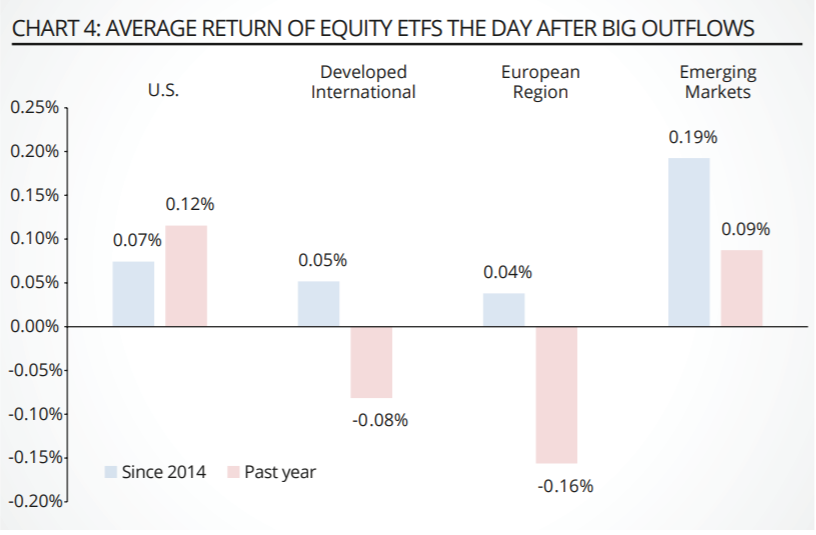
The persistence of outflow cannot be explained by serial correlation in funds’ returns because prices tend to bounce back after large outflow days. This effect is particularly strong among emerging markets funds, which usually have greater liquidity constraints. Intuitively, it is easy to see how a bad day for emerging markets leads to large ETF redemptions, which further accentuate losses, resulting in positive simultaneous correlation between flows and returns.
Selling may carry over to the next day after investment committee meetings are completed in the morning. However, prices tend to recover as the supply and demand imbalance created by abnormal selling flow gets digested by market participants, resulting in a negative next day correlation between flows and returns. Looking at the relation between ETF prices and their net asset values should help us better understand this relation, which we shall do now (see graph 4).
Do big ETF outflows create discounts to NAVs?
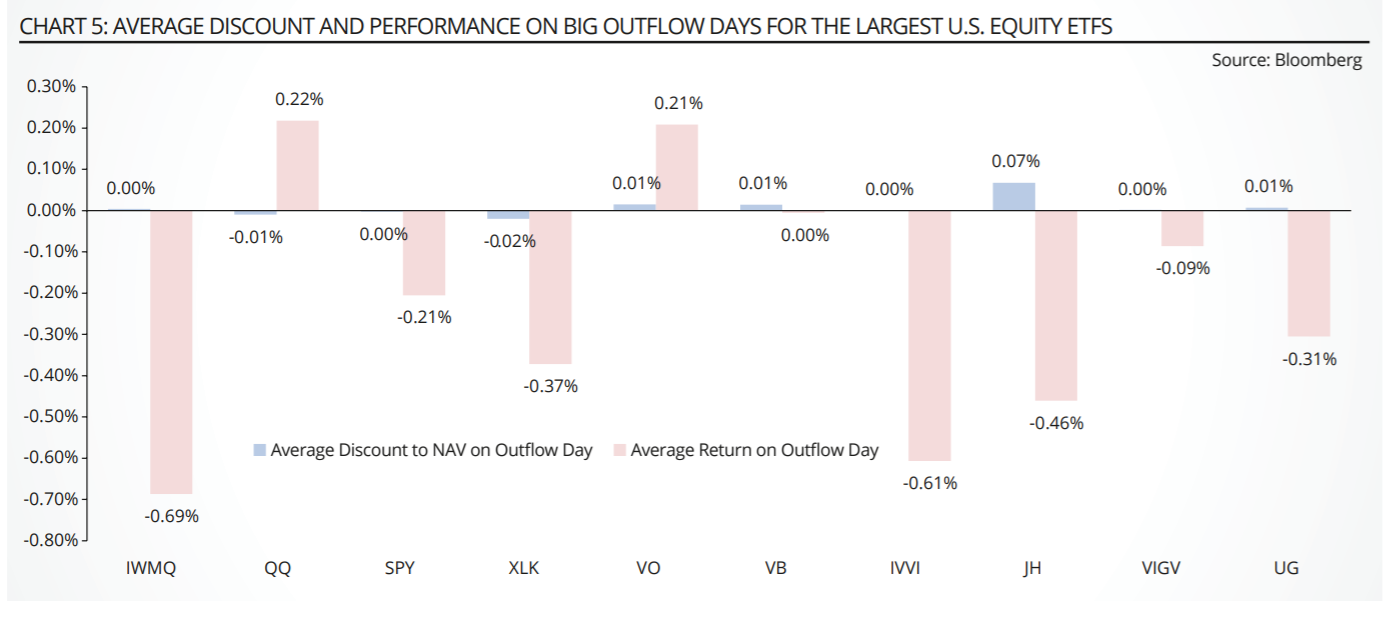
As expected, the largest US equity ETFs barely diverge from their net asset values, even on big outflow days. Large outflows do tend to coincide with significant price decline for IWM, SPY, and IVV but well-oiled arbitrage mechanisms ensure that these funds always trade within a few basis points of their net asset values (see graph 5).
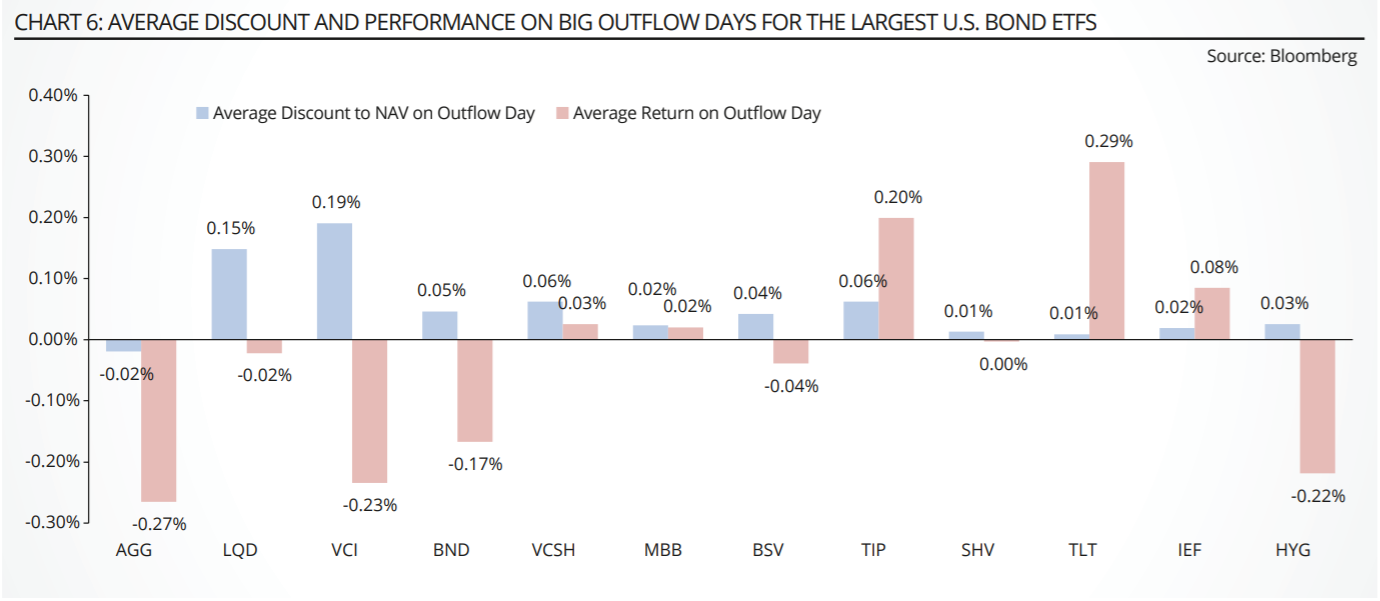
Fixed income ETFs are often seen as more vulnerable to liquidity events because of the fragmented structure of bond trading. However, most of the large bond funds stood the tests of large outflows. The largest bond ETFs have tended to trade at a small premium to their net asset values on large outflow days.
This would be expected of funds which hold highly liquid Treasury bonds and notes, such as AGG or TLT, or high-grade corporate bonds such LQD and VCSH. HYG (iShares iBoxx High Yield Corporate Bond ETF) has also been tested by large redemptions, losing more than 2% of its assets on 35 days in the past two years, but the fund kept trading in line with its net asset value (see graph 6).
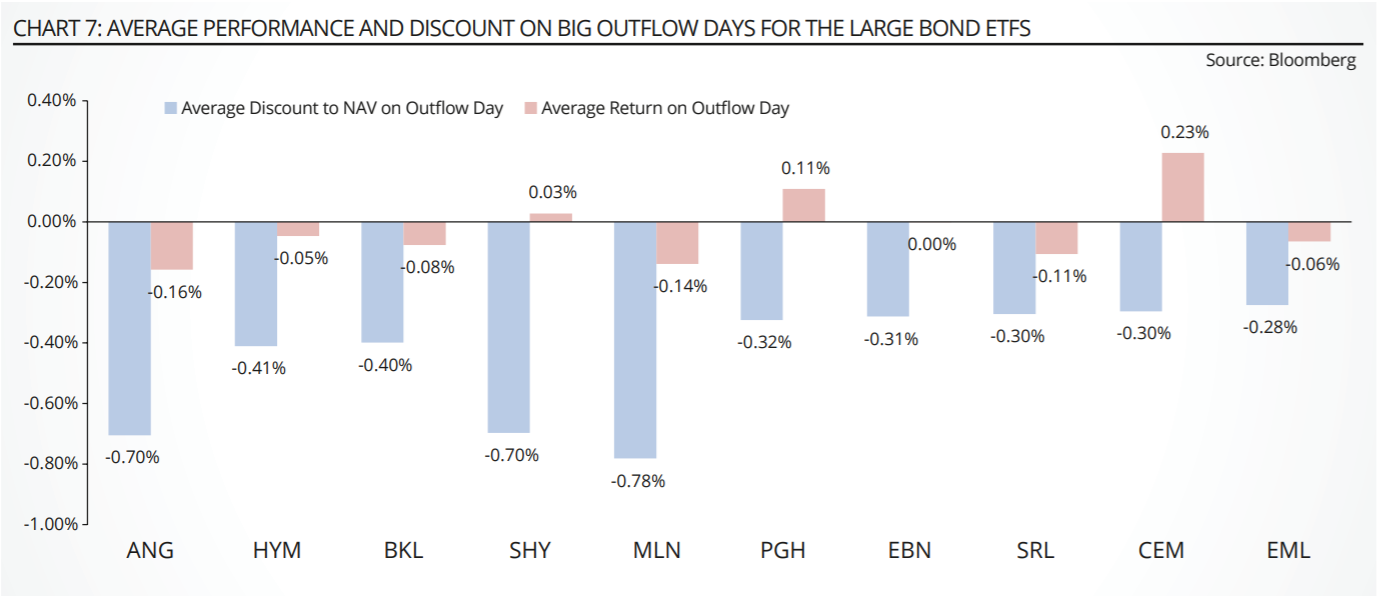
However, not every high-yield ETF is immune to the effect of large outflows. For example, ANGL, which invests in “fallen angel” bonds, has traded at an average discount-to-NAV of 45 basis points on big outflow days. Smaller municipal bond funds, loan funds, and emerging markets bond ETFs also deviate significantly from their net asset values on heavy redemption days (see graph 7).
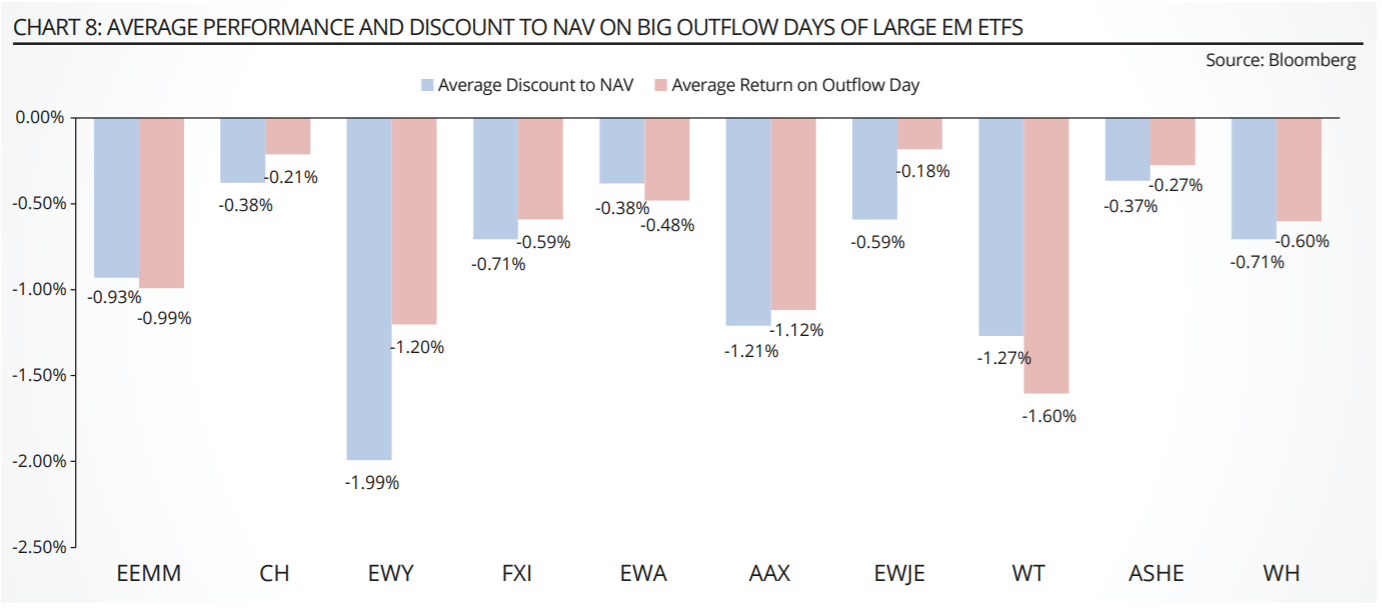
Massive redemptions are also associated with large discount-to-NAVs for most emerging markets equity funds. The effect is strongest for Asia-oriented funds. For example, EWY (iShares MSCI Korea) and EWT (iShares MSCI Taiwan) have experienced discounts-to-NAV of 2.0% and 1.3%, respectively, around large redemption days.
Part of this effect may be explained by time zone differences, rather than a deficiency of ETFs arbitrage mechanism. The Korean market is not open when the New York Stock Exchange closes, which means that the prices used to compute net asset value for locally traded securities are carried over from the Korean close the prior day.
Since large redemptions usually happen on down days, traders and market-makers of Asian ETFs adjust their quotes based on prices observed during US market hours, leading to significant deviations between quoted prices and stale net asset values (see graph 8).
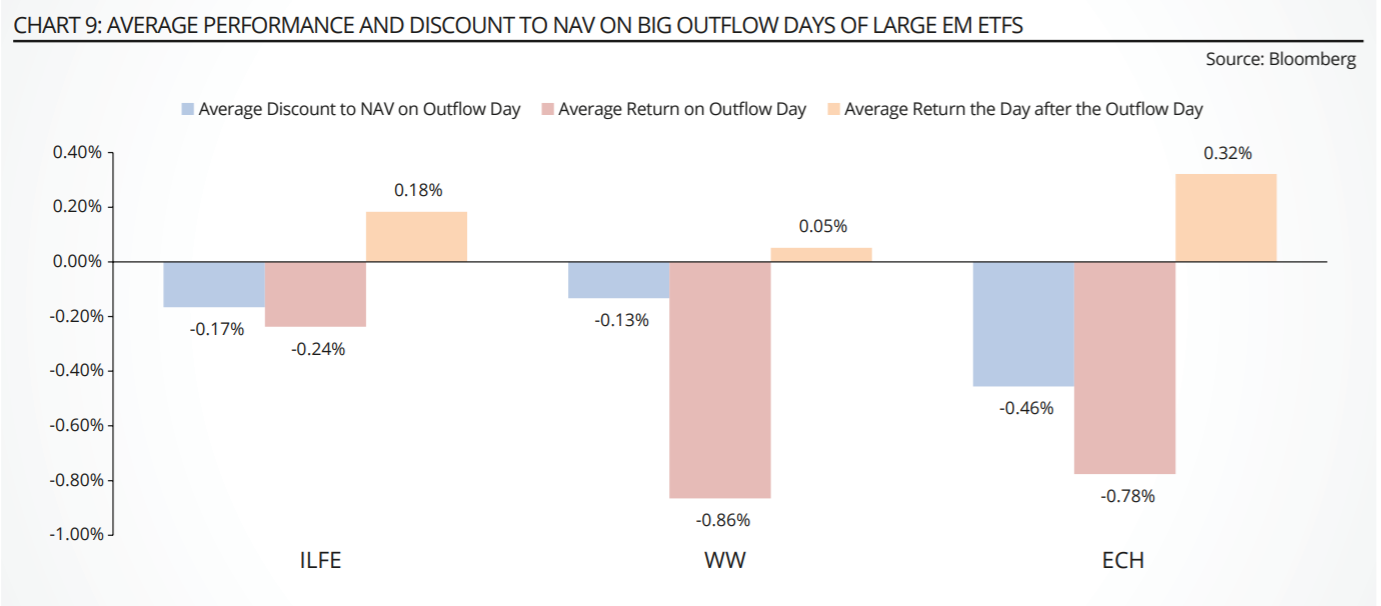
That being said, liquidity issues may be an aggravating factor. Latin American ETFs also tend to trade at abnormally large discount to net asset value on big outflow days, even though most local bourses’ trading hours greatly overlap with those of the major US exchanges. For example, ECH (iShares MSCI Chile ETF) has traded at an average discount of 46 basis points to its net asset value on the 35 days when it experienced outflows of more than 2% of its assets.
The fact the fund also experienced heavy losses on these days (78 basis point) and a mean-reversion bounce of 32 basis points the next day is consistent with the hypothesis that large ETF outflows cause temporary disruptions in the local market.
Of course, this does not mean that investors are able to pocket the entire bounce because market makers may increase their spreads when they are overwhelmed with sell orders that they cannot easily hedge. For example, it is quite risky for market makers to take large sell-on-close orders in New York when the Santiago Stock Exchange is closed and the local market may not offer sufficient liquidity to execute the order the next day (see graph 9).
Do big ETF outflows create a buying opportunity the next day?
Investors should not expect to get rich simply by counting ETF shares. For most days and most funds, flows-based short-term trading strategies would have the same probability of success as a coin flip. As shown in the chart below, flows into SPY explain less than 1% of its performance the next day. Taking the other side of the ETF crowd offers no service for highly liquid funds with well-oiled arbitrage mechanisms (see graph 10).
This is not the case for smaller funds where the underlying basket cannot easily be traded due to time zone constraints, different settlement rules, political risk, and shallow liquidity. In a typical emerging market panic attack, bad news triggers waves of sell orders. Market makers and brokers may not be able to hedge their books, especially if the local market is closed or if circuit breakers constrain trading. Spreads usually widen to compensate for the risk of holding unhedged shares overnight.
In this case, contrarian investors who take the other side of the ETF trade do provide liquidity to the market. This service tends to be compensated: most small emerging markets ETFs tend to rebound by 30 to 70 basis points the day following abnormal outflows. Investors may not be able to capture the full rebound because wider-than-usual spreads will shrink their expected gains.
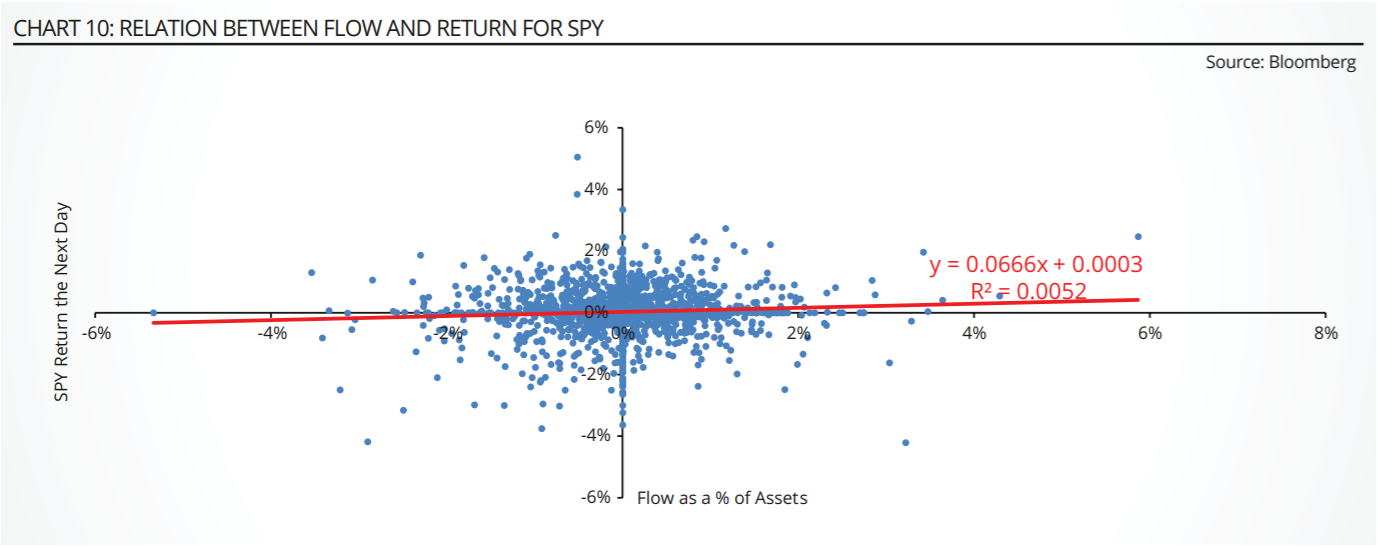
In addition, these gains are not without risk: investors are compensated for taking on risks that ETF sellers are no long willing to assume, i.e. buying Chilean stocks when riots erupt, buying Chinese stocks after threatening tweets from Trump, etc. But at least the strategy offers a positive trade-off between risk and reward, in a world where so many assets offer return-free risk and most safe assets trade at negative yields (see graph 10).
Vincent Deluard is global macro strategist at INTL FCStone
This article first appeared in the Q1 2020 edition of Beyond Beta, the world’s only smart beta publication. To receive a full copy, click here.


