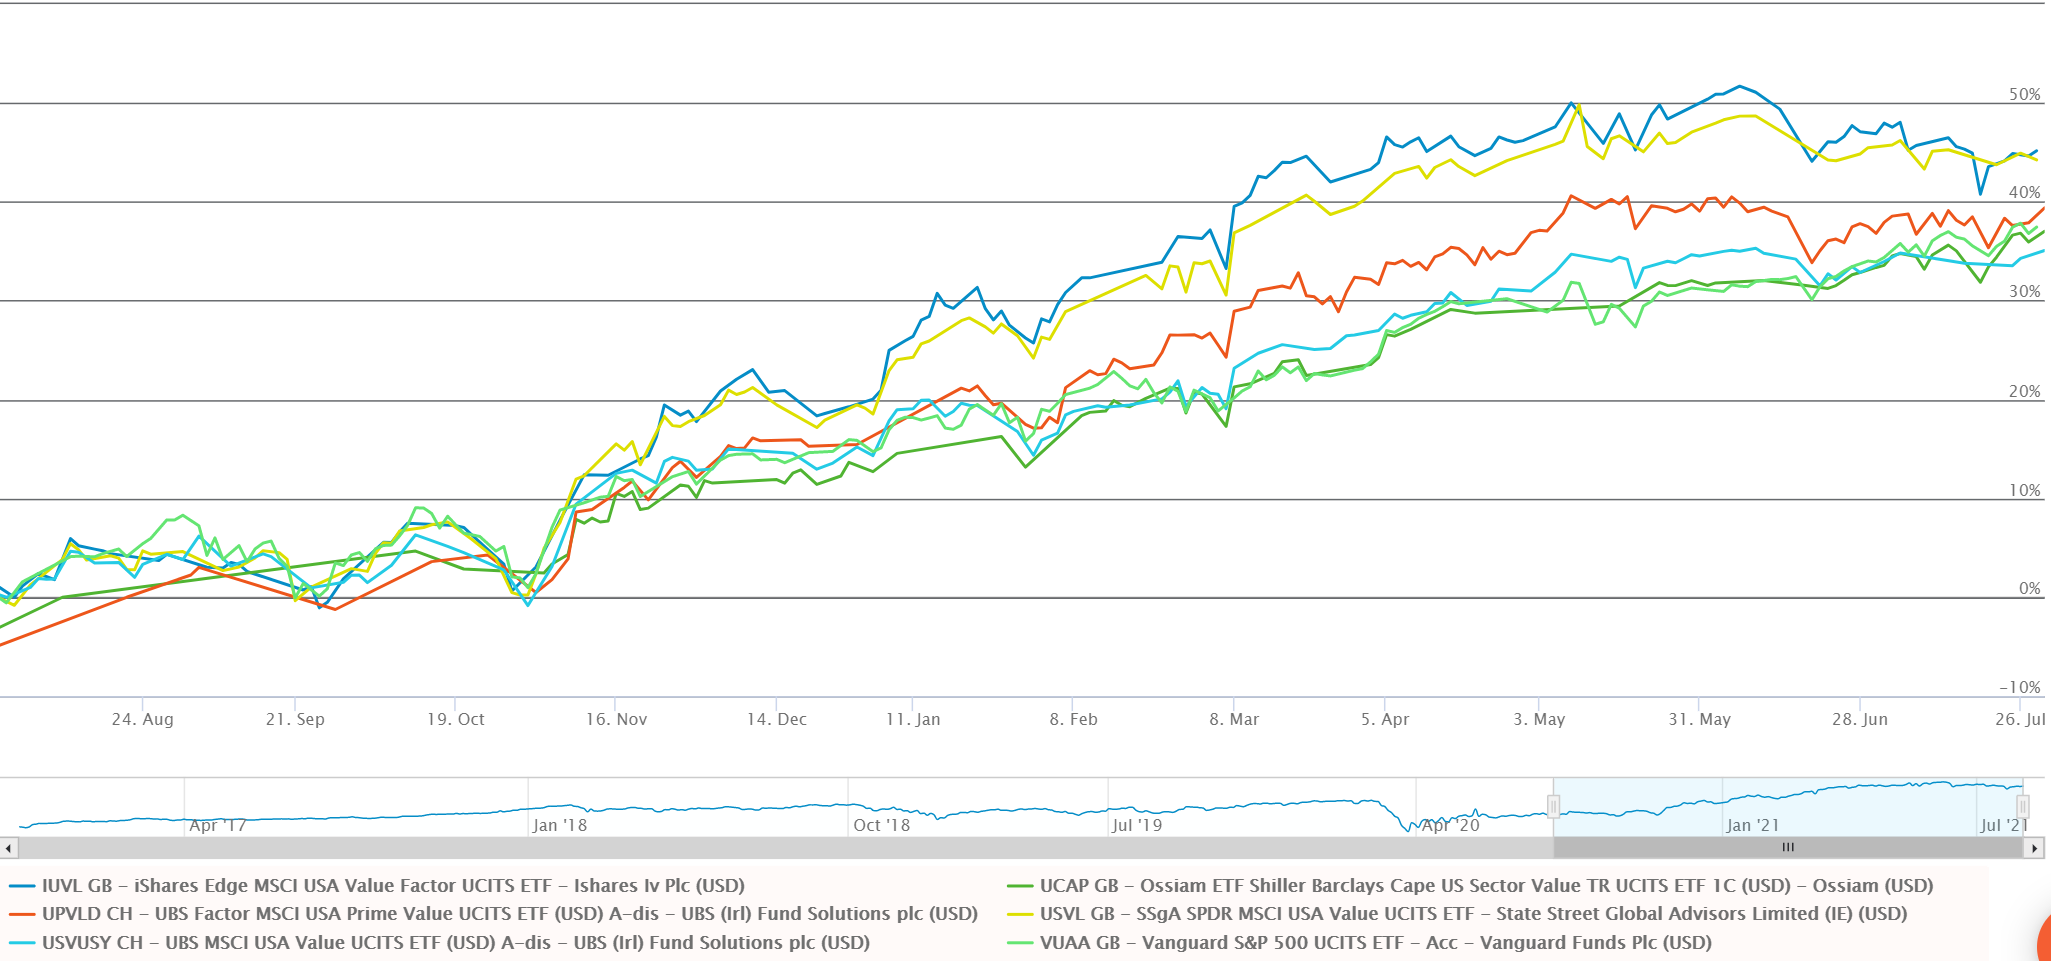
US value ETFs remain in vogue as the short-lived dip in mid-July shows the recovery trade may still have a little longer to run.
Having seen €160bn outflows between July and November last year, the publication of Pfizer’s vaccine results saw value ETFs gather €4.3bn in the subsequent four-month period, according to data from Bloomberg Intelligence.
Rallying off the back of positive vaccine news, the US economy continued its strong uptick, albeit with a different tone to 2020. The tech and healthcare-heavy growth equity category was king of the hill in the height of the pandemic, however, since the turn of the year, value’s dominance has been demonstrated by the S&P 500 Pure Value index outperforming its parent benchmark by 5.5% year-to-date.
The established nature of the cyclicals and value rotation was also evidenced when the laggard iShares Edge MSCI Momentum Factor UCITS ETF (IUMF) underwent a considerable overhaul in June, evicting previously overweight tech names and increasing allocations to financials and energy sectors from a combined 1.5% to 34.4%.
Even as markets hinted towards a return to growth in June, regulatory interference by the Chinese Communist Party (CCP) saw the Nasdaq post its worst single day drop since March last week. Meanwhile, a level-headed update from the US Federal Reserve saw real bond yields fall as low as 1.2%, while the VIX volatility index fell more than 8% in the following 24-hour period.
With a view that the value rotation may have further yet to run, ETF Stream looks at five ETFs offering exposure to US value equities.
iShares Edge MSCI USA Value Factor UCITS ETF (IUVF)
Launching in 2018, the $4.2bn IUVF ETF is the youngest and largest US value factor strategy available to European investors.
Tracking the MSCI USA Enhanced Value index, the product’s 150-constituent basket means it has a narrower focus than some of its other US value peers and is just under a quarter of the size of its parent index, the MSCI USA index.
To be included within the index, companies must outperform their GICS sector average on value metrics including price-to-forward earnings ratio, price-to-book ratio and enterprise value-to-cash flow from operations.
Despite being scored by MSCI as the most value stock overweight index available in its US value factor roster, six out of ten of the enhanced value index’s largest weightings are allocated to tech and healthcare stocks – which are typically associated with growth factor – while 27.2% of the entire index goes to information technology, in line with the vanilla S&P 500 index.
Ossiam Shiller Barclays Cape US Sector Value UCITS ETF (UCAP)
The second largest US value factor strategy and one of three launched in 2015, the $1.5bn CAPE ETF shares IUVF’s bias towards popular growth names.
Tracking the Shiller Barclays CAPE US Sector Value index, UCAP offers synthetic exposure to 258 US equities in the consumer staples, financials, real estate, communication services and IT sectors, while having no allocation to materials, industrials, utilities, energy, consumer discretionary or healthcare.
With a self-proclaimed bias to large-cap equities, the index applies a Shiller P/E ratio or cyclically adjusted P/E ratio methodology, which scores S&P 500 constituents based on their price divided by an annualised ten-year average of their earnings, adjusted for inflation.
Though rebalanced monthly, the strong sales performance of the large cap growth segment means they have a dominant role in UCAP’s underlying index with Facebook, Amazon, Google and Microsoft all appearing in the top five allocations while the top ten holdings are very reminiscent of the S&P 500 – but overweighted (around 36% of the total).
UBS ETF Factor MSCI USA Value UCITS ETF (USVUSY)
The first of two UBS products and the oldest on the US value line-up, the $1.3bn UC07 ETF is the most diversified US value factor strategy that still excludes some companies from its parent index.
Tracking the MSCI USA Value index, USVUSY offers exposure to 428 large and mid-cap US equities.
Using a narrower array of valuation metrics than its younger cousin, the enhanced value index, MSCI’s original USA value benchmark relies on a methodology which blends book value to price with 12-month forward looking P/E and then adds a screen for dividend yields.
According to MSCI’s factor box, its USA Value index has more small cap exposure than its Enhanced rendition but scores lower on yield, despite its dividend screen. Its top holdings do look more like a stereotypical value basket, however, with JP Morgan, Johnson & Johnson, Home Depot, Berkshire Hathaway, Bank of America and Exxon Mobil among the established names taking the top spots, while its largest sector weighting – 20% – given to financials.
UBS ETF Factor MSCI USA Prime Value UCITS ETF (UPVLD)
The newer UBS US value factor ETF, the $710m UPVLD, tracks a leaner MSCI index.
Attempting to mirror the MSCI USA Prime Value index, UPVLD offers exposure to 155 large and mid-cap US stocks.
The prime benchmark vaguely defines its value style methodology as seeking out companies with relatively low valuations and higher quality characteristics. However, while the index tracked by USVUSY has significantly underperformed the MSCI USA over the last 15 years, the prime index is the only MSCI USA value index to have beaten its parent benchmark over that period.
Four healthcare firms feature in the Prime index’s top ten holdings along with consumer staple names – Walmart and Costco. Interestingly, Truist Financial is the only financials holding in the top ten, yet the index is weighted 25.9% towards financials equities.
SPDR MSCI USA Value Weighted UCITS ETF (USVL)
Finally, SSGA’s $190m USVL caps off the list as the smallest US value factor ETF and one of three unveiled in 2015.
Tracking the MSCI Value Weighted index, USVL is the only US value ETF retaining exposure to all 627 of the mid and large-cap constituents of its parent benchmark.
Rather than including or excluding, stocks in the original universe are weighted according to their scores regarding ‘fundamental accounting data’ which includes metrics such as sales, book value, earnings and cash earnings.
Scoring similarly to the original MSCI USA Value index on value, small cap, quality and volatility exposure, the value-weighted index used by USVL is rated lower regarding income potential.
Similarly, while offering also offering a large weighting to financials – 21.2% – it increases the allocation to information technology, up to 16.3%, versus 11.6% for the original MSCI USA value benchmark. Its top holdings feature Apple, JP Morgan, Bank of America, Microsoft and Berkshire Hathaway.
The bottom line on US Value ETFs
All of the ETFs above tracking an MSCI benchmark have a total expense ratio (TER) of 0.20%, meaning the exception is Ossiam’s UCAP with its considerably higher TER of 0.65%.
As an apt illustration of how important it is to consider index design while selecting an ETF, only three out of five of the US value factor ETFs discussed have outperformed the straightforward Vanguard S&P 500 UCITS ETF (VUAA) over the 12 months to 29 July, according to data from ETFLogic.
This is concerning given not only was this meant to be a period of value factor resurgence, but also given VUAA charges a TER of 0.07%, almost a tenth of that charged by Ossiam’s ETF, which was one of the two which underperformed VUAA.


