Having a sophisticated model like Parala Capital’s can provide useful insights when making investment decisions but at a minimum, it is important for investors to understand each active ETF’s characteristics, risk factor exposures, business cycle sensitivities and sources of added value.
Parala has historically selected passive ETFs to reflect the desired asset class, market, factor and sector exposures in its portfolios.
However, a recent Morningstar report highlighted the growth of active ETFs which are approaching a 10% market share globally.
The growth is partially driven by tax advantages in the US, transparency and mutual fund conversions but are nevertheless an interesting and valuable contribution to the range of available ETF offerings and an area of innovation to keep an eye on.
While the ETF wrapper itself does not boost an investment manager’s alpha-generating skills, there are some ‘features with benefits’.
Firstly, many of the recently launched active ETFs have lower management fees than traditional mutual funds.
Secondly, large fund houses can offer systematic strategies at low cost which provides investors with potential performance benefits from deep security level and/or factor research.
Thirdly, active ETFs provide the flexibility for fund managers to include qualitative judgement in their selection criteria which may be particularly beneficial in fixed income where price discovery is lower and/or to incorporate in-house ESG research in the security selection.
Lastly, aided by white-label ETF platforms, investors can access potentially differentiated and innovative offerings from boutique and/or less known managers in an easily tradeable format.
Actively managed UCITS ETFs in our analysis
The active ETFs below were selected to highlight different investment approaches within global equities provided they had a sufficient length track record for analysis.
Collectively, they represent the four ‘features with benefits’ described in the previous paragraph.
Since four of the five ETF offerings include ESG features, I will also include the MSCI World ESG in the analysis because it will approximate any differentiated performance attributable to a passive exposure with ESG criteria (see Chart 1).
Chart 1: Actively managed UCITS ETFs in our analysis

Different investment approaches with different levels of active risk
There are three types of strategies being employed across these five ETFs:
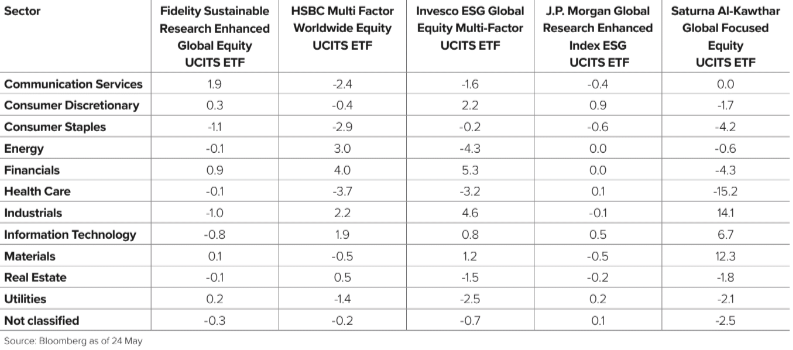
Research based security selection to add value sector weights are kept very close to the benchmark. This includes the Fidelity Sustainable Research Enhanced Global Equity UCITS ETF and the JPM Global Research Enhanced Index Equity (ESG) UCITS ETF. Notice that both offerings include the word ‘Enhanced’ so they must be good.
Factor based research and portfolio construction to add value. Sector weights deviate from the benchmark with tight risk limits. The HSBC Multi Factor Worldwide Equity UCITS ETF and Invesco ESG Global Equity Multi-Factor UCITS ETF are examples of this approach.
Concentrated portfolio with high active sector risk to add value. The Saturna Al-Kawthar Global Focused Equity UCITS ETF reflects this type of investment strategy (see Chart 2).
Chart 2: Active sector weights relative to the MSCI World index
Tracking error relative to the MSCI World
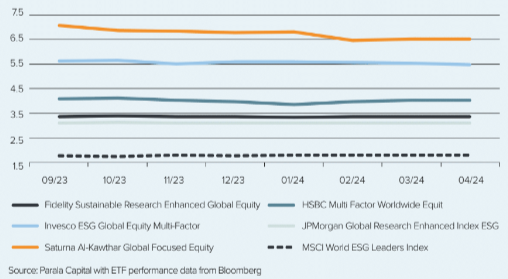
The ETFs with the lowest tracking error relative to the MSCI World are the Fidelity International and JP Morgan Asset Management (JPMAM) ETFs.
They both seek to add value through security-level research and their sector weights are kept close to the benchmark. The ETFs with medium-level tracking error include the HSBC Asset Management and Invesco ETFs.
They aim to add value through multi-factor portfolio construction which allow for controlled but active sector risk. The Invesco ETF has higher active sector risk relative to MSCI World and higher tracking error than the HSBC ETF.
This is also a result of more dynamic and diverse factor exposures than the HSBC ETF which you can see in an upcoming chart. Interestingly, these two ETFs take some opposing bets in consumer discretionary, energy, materials and real estate.
The ETF with the highest tracking error is the Saturna Al-Kawthar UCITS ETF which runs a concentrated portfolio with large sector deviations from the benchmark.
Lastly, you can see that employing ESG in the selection criteria adds around 1.8% tracking error as illustrated by the MSCI World ESG Leaders index (see Chart 3).
Chart 3: Rolling three-year annualised tracking error relative to the MSCI World
Rolling three-year market beta relative to the MSCI World
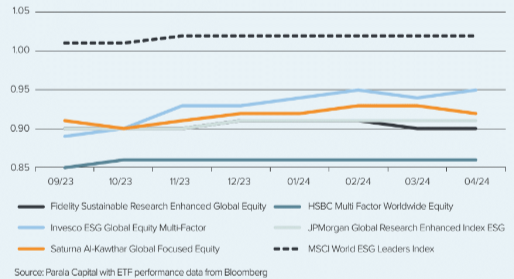
Beta measures the systematic market risk of an investment strategy using MSCI World as the market risk factor. The chart below shows us the systematic risk of the five ETFs and how it has changed over consecutive rolling three-year periods.
A strategy with a beta of one would be said to have systematic risk equivalent to the MSCI World which is about what we see for the MSCI World ESG Leaders index.
We can see from the below chart that the investment strategies all have a lower market beta than the MSCI World. We can also see that the Invesco ESG Global Equity Multi-Factor UCITS ETF increased its market risk between September 2023 to April 2024 and the ETF with the lowest beta to the market is the HSBC Multi Factor Worldwide Equity UCITS ETF.
Interestingly, despite having a higher tracking error, a concentrated portfolio and a high level of active sector risk relative to the MSCI World, the Saturna Al-Kawthar Global Focused Equity ETF had a lower level of market-related risk (see Chart 4).
Chart 4: Rolling 3-yr market beat relative to the MSCI World
Long-term risk factor exposures of each global equity active ETF
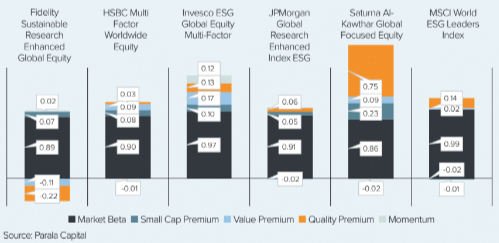
We can now engage in a deeper analysis to see which combination of factors best explains each ETFs returns using Parala’s investment technology. We can see that all the ETFs have different risk factor exposures.
The Fidelity ETF has a negative exposure to the value and quality risk premiums whereas the Saturna Al-Kawthar ETF has the highest exposure to the quality premium.
The Invesco ETF has a diverse range of factor exposures including momentum whereas the HSBC ETF has more narrow factor tilts and a lower market meta than the Invesco ETF.
Despite both carrying “multi-factor” in their name, they have differentiated exposures (see Chart 5).
Chart 5: Long-term risk factor exposures of each global equity active ETF
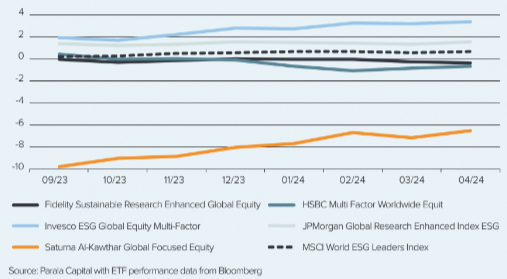
Rolling three-year alpha relative to the MSCI World Index
With the caveat that we are measuring alpha over a relative short time during a period of high dispersion, we can see that the Invesco ETF generated the most alpha on a risk-adjusted basis relative to the MSCI World followed by the JPMAM ETF.
Interestingly, we can see that a passive exposure to the MSCI World ESG Leaders index also generated alpha which may be explained by its higher exposure to the quality risk premium during a period when quality outperformed the broad market.
Saturna’s ETF performance was negatively impacted by a combination of its sector exposures and security selection within the sector. In their defence, the extreme sector dispersion and concentration of performance in the magnificent seven made it a challenging period for highly active managers (see Chart 6).
Chart 6: Global equity actively managed ETF return sensitivities to key business cycle variables
Global equity actively managed ETF returns
When evaluating the risk and return behaviour of these actively managed UCITS ETFs, Parala’s model captures not only each ETF’s exposure to five important risk factors including market beta, small cap, value, quality and momentum risk premiums but also the fact that the performance of the risk factors themselves are sensitive to the business cycle.
Each ETF also has an important residual component of its return which is independent to the risk factors but is correlated with the business cycle. We can call this component of the return “macro alpha”.
It varies over time and is associated with navigating changes in the business cycle. It may be due to differences in each ETF’s active sector weights and security selection within each sector.
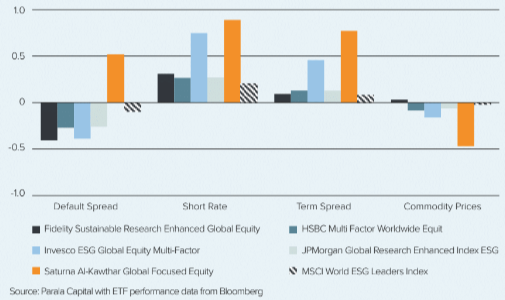
We can identify these relationships using important macroeconomic variables like the default spread, term spread, short-term interest rate and commodity prices.
Based on their sensitivities to these macroeconomic variables we gain additional insights into their likely behaviour across the business cycle.
For example, all the strategies apart from the Saturna El-Kawthar ETF, have a negative sensitivity to the default spread so if default risk decreases, as it has done for the last few years, these ETFs would be expected to benefit whereas the Saturna El-Kawthar ETF would see a positive return contribution if default risk increased.
The Invesco ETF has a higher positive sensitivity to both the short rate (three-month US Treasury Bill) and the term spread than most of its peers in this analysis.
If the short rate were to decline, the Invesco ETF would be more negatively impacted whereas if the term spread turned more positive it would stand to benefit more than its peers. Commodity prices reflect supply/demand, inflation and geopolitical risks.
If commodity prices were to increase, the Fidelity ETF would be the least negatively impacted due to its slight positive sensitivity to commodity prices whereas its peers have a negative sensitivity to changes in commodity prices so a spike in commodities would be expected to dampen the returns of the HSBC AM, Invesco, JPMAM and Saturna El-Kawthar ETFs (see Chart 7).
Chart 7: Global equity actively managed ETF returns
Conclusion
Over the last decade, investors have embraced indices, ETFs and passive investing at the expense of active management.
However, active ETFs have become a growing segment of the ETF market in recent years. Is it time for investors to get more active when considering their investment allocations?
Metaphorically speaking, being active can be good for one’s health and well-being although it does take more time and effort.
Active ETFs cover a range of strategies seeking to add value from security level research, combining risk factors, incorporating ESG and/or qualitative judgement that may be difficult to deliver as a pure rules-based index.
For investors that embrace the ETF wrapper, the proliferation of active ETFs just increases the tools in the toolkit. However, these ETFs are not pure index trackers and transparency may be more limited.
There may be added complexity from understanding the objectives and risk limits of the ETF, its risk factor exposures which may be dynamic as well as quantifying the manager’s all-weather alpha abilities and time-varying skills across the business cycle.
These are important considerations to ensure the active ETF fits within an investor’s overall portfolio.
Steven Goldin is managing partner at Parala Capital, which provides institutional investors and asset owners with asset allocation advice using advanced quantitative technology based on the academic research of its founding partners
This article first appeared in ETF Insider, ETF Stream's monthly ETF magazine for professional investors in Europe. To read the full edition, click here.
