The dizzying array of options provided by 18 vanilla S&P 500 ETFs in Europe may leave some professional, let alone retail, investors in a state of confusion. However, two worthy candidates are offered by Vanguard and Invesco with their VUSA and SPXS ETFs.
Given these ETFs are tracking the most popular equity index globally, with the top three products in Europe alone housing over $103bn assets, competition is fierce and margins between winning and middling strategies can be extremely narrow.
This also plays out when we look at the two ETFs in our comparison. Europe's third-largest ETF, the $33bn Vanguard S&P 500 UCITS ETF (VUSA), returned 97.3% over the five years to 2 February 2024 and 35.3% over the trailing three years, according to data from justETF.
Meanwhile, the $14.5bn Invesco S&P 500 UCITS ETF (SPXP), part of the largest synthetic ETF strategy in the world, returned 98.1% and 35.1% over the respective periods.
These narrow margins are also reflected in costs. While more expensive than the minute three basis points Vanguard charges for its US-listed S&P 500 ETF, VUSA has a low total expense ratio (TER) of 0.07%.
Invesco’s SPXP comes very close to that figure with a TER of 0.05%, however, it carries a swap fee of 0.04%. The ETF then narrows its two-point deficit with a bid-ask spread on primary listing of 0.04% versus 0.05% for VUSA, according to data from Bloomberg Intelligence.
Taking a zoomed-out view, sometimes all that separates these ETFs are a handful of percent in returns and a couple of basis points when it comes cost of ownership.
Issuers set out the use cases of their ETFs
Despite a seemingly close race, issuers are quick to remind us of the unique selling points of their products and how they differentiate from competitors.
David Hsu, product specialist at Vanguard, said: “At Vanguard, our product philosophy is to be ‘true to label’ across all of our ranges, whether active or index. The reason is pretty straightforward – we want to keep our funds as simple to understand, predictable, and transparent as possible for investors.
“As a result, we tend to favour physical products. They do exactly what they say on the tin – they hold all the securities and receive all the income returns (minus cost and tax) generated by the index performance.
“We shy away from synthetic replication because of the complexity. In particular, we are mindful that since the contracts employed in the replication process remain confidential between parties, there is often no way to effectively attribute the individual performance of swaps. These can also suffer from currency volatility in relation to their collateral; for instance, the US dollar moved significantly last year against all major currencies.”
Responding on SPXP and the advantages of using swaps as part of synthetic replication, Dr Christopher Mellor, head of EMEA equity and commodity ETF product management at Invesco, said: “We have a wide range of investors that use our S&P 500 ETF for their US equity allocation. It is the largest synthetic ETF in the world and assets in the fund have increased fivefold over the past five years.
“A large part of the success of the fund is due to the performance advantage offered by its swap-based investment approach. While the use of swaps introduces counterparty risk to the ETF, we seek to reduce the risk through a range of measures, from using multiple swap counterparties (six of the largest global banks for this ETF) to resetting the swaps to zero with tight reset triggers.
“It is also worth noting that a physically replicated ETF that engages in securities lending will also have counterparty risk. We find that investors in our fund are comfortable with the mitigating steps we take to minimise counterparty risk and are happy to participate in the structural performance advantage offered by the approach.”
It is worth noting VUSA does engage in securities lending.
The debate then turns to tax treatment of dividends, with the issuers facing different US withholding tax (WHT) treatment based on their ETFs’ replication methodologies.
Commenting on Vanguard’s approach, Hsu said: “Some of the choice between physical or synthetic replication also comes down to domicile. Irish domiciled ETFs, such as VUSA and the rest of our UCITS ETF range, benefit from an advantageous 15% WHT rate, over both Irish mutual funds and products domiciled in Luxembourg, both of which are charged 30%.
“As a result, Luxembourg based products often use swaps where possible, to get around the WHT headwind for the S&P 500.”
Mellor added: “A change in US legislation in 2017 (the introduction of the HIRE Act) means that the fund is able to pass through gross dividend performance i.e., 0% WHT, less fees, to investors. The best physically replicating funds domiciled in Ireland are able to reduce the impact of WHT from 30% to 15% due to tax treaties between the US and Ireland."
Over the five years to january 2023, the performance gap between synthetic and physical was 1.25%, Mellor said.
While Vanguard scores a point for the fact its structure is easy to understand for investors of all levels, to imply its resulting value chain is simpler may be inaccurate, given the sophistication of the capital markets and portfolio management work done, even on passive, physical ETFs, not to mention securities lending arrangements.
Invesco levels the playing field by taking advantage of its structure, likely offering one of the only US equity exposures effectively paying zero withholding tax within a UCITS wrapper.
The firm achieves this by ensuring SPXP’s substitute basket is restricted to non-dividend paying stocks.
Based on the S&P 500 dividend yield of 1.62% last December, this affords SPXP an additional 0.24% of tax savings per annum.
Analyst opinions on VUSA and SPXP
Turning to external experts, the winning candidate divides opinion among analysts.
Athanasios Psarofagis, ETF analyst at Bloomberg Intelligence, said: “It is a close call. In the USA I would say the Vanguard strategy but in Europe, there is a nice little tax edge with the synthetics so I like SPXP, as it eeks out slightly better performance. Also, synthetic is not really a scary word anymore.”
However, Morningstar analysts voted in the opposite direction. While both ETFs earn five-star Morningstar ratings, VUSA also earned a ‘Gold’ Morningstar quantitative score owing to its high scoring on ‘people, process and parent’ attributes.
Speaking on its ‘above average’ rating for ‘people’, Morningstar’s Managed Investment Report said Vanguard products benefit from the firm’s integrated team of portfolio managers across its global index fund and ETF businesses.
“Vanguard uses a global team approach to management and trading in which portfolio managers manage and trade assets locally.
“However, each portfolio manager can carry out other team members’ responsibilities. The European and Australian teams are entirely integrated with the US team, using the same processes and systems. This ensures broad knowledge across the group and provides continuity in contingency scenarios."
SPXP earned a ‘Silver’ Morningstar quantitative score but also received an ‘above average’ score for ‘people’.
Its report read: “The management team running the fund has provided it with a favourable record compared with category peers.
“Over the past three-year period, the fund was among the top 20% performing funds in its peer group category, US Large-Cap Blend Equity. And managers generated alpha, over the same period, proving their effectiveness.”
ETF Stream analysis
The amount of technical analysis that can go into asset allocation, from looking at where issuers domicile their funds, to liquidity, to execution costs, can at times seem more costly than the difference between the products on offer. This conclusion may well ring true for the products in this comparison.
While the Vanguard and Invesco ETFs go about their S&P 500 exposure in different ways the key difference in performance comes from comparing VUSA as a distributing product to SPXP, which is an accumulating product.
Notably, both products use pound sterling as their trading currencies, making their performance charts appear more impressive than their US dollar equivalents; however, Invesco does not offer a like-for-like equivalent to Vanguard’s VUSA, as a sterling, distributing share class.
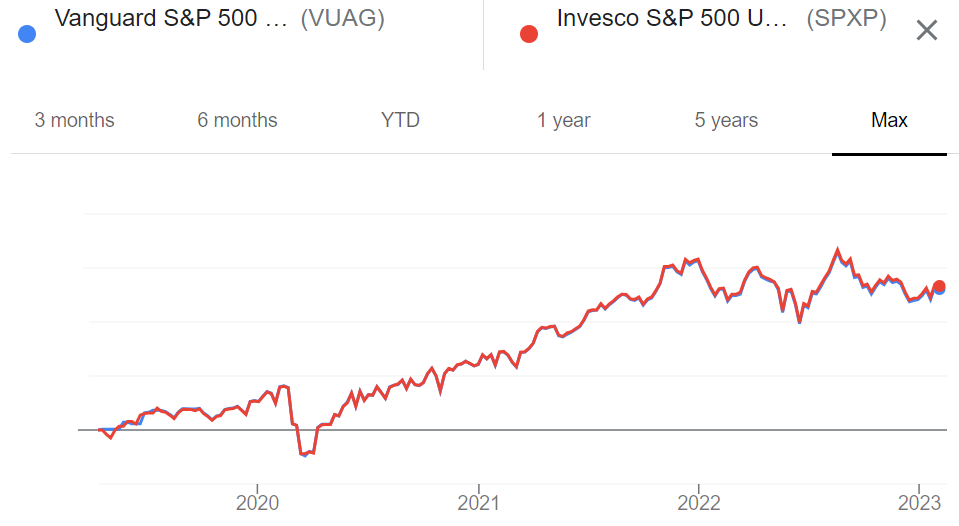
Instead, the equivalent comparison for SPXP would be to Vanguard’s far younger and lesser-known VUAG ETF. As shown below, the performance between the two has been virtually indistinguishable since the latter launched in May 2019.

Source: Google Finance, Morningstar
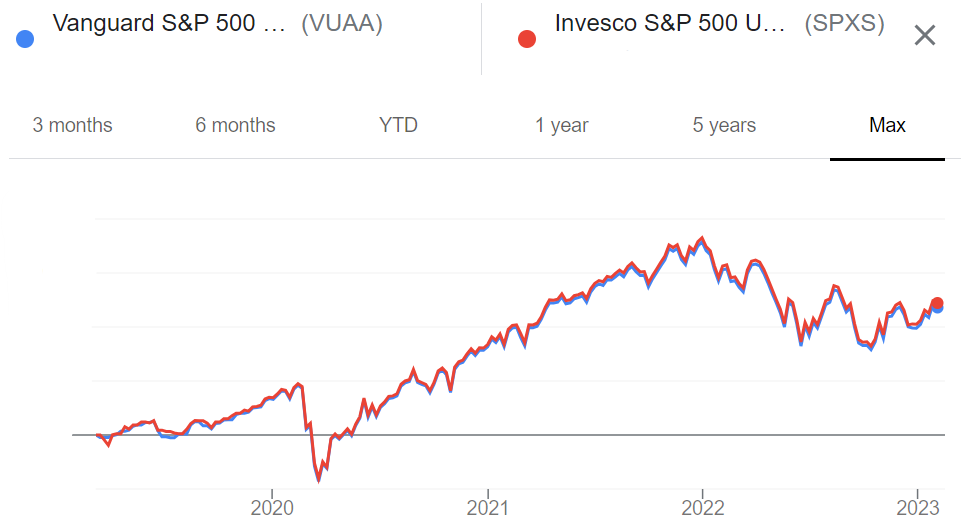
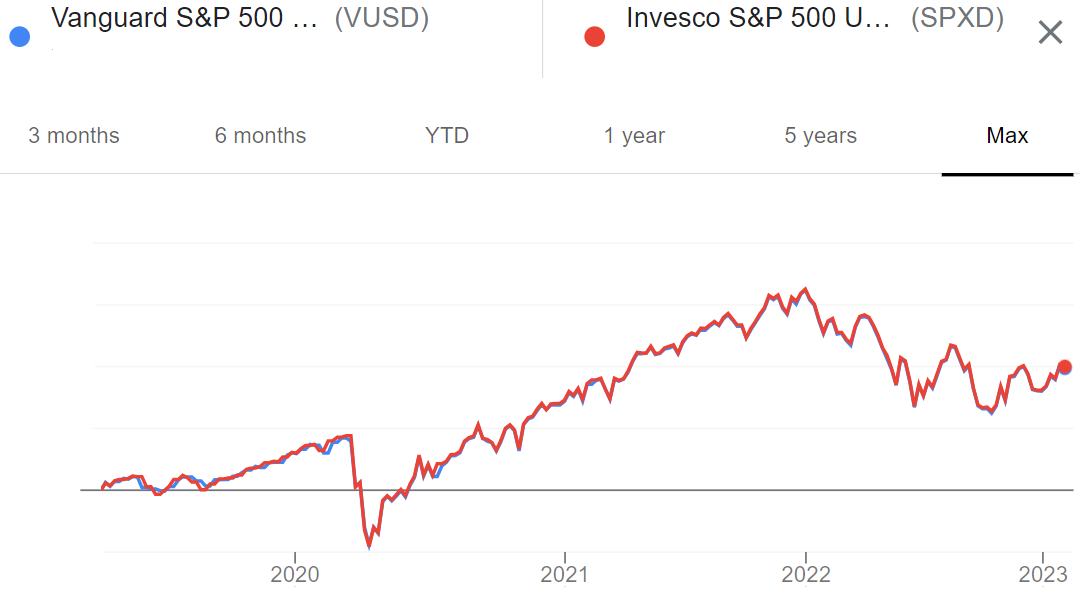
Interestingly, the same rings true for the other share classes Vanguard launched and their opposite numbers from Invesco.
This includes the dollar trading currency, accumulating share classes.

Source: ibid
As well as the dollar trading currency, distributing share classes.

Source: ibid
As for which product ends up being king of the S&P 500 ETFs in Europe, the two will either have to share the crown or continue hashing it out in increasingly granular analysis.
As for investors, the comparison acts as a useful reminder to check under the bonnet of your ETF and to be mindful of the impact replication methodologies, currency and income distribution can have on long-term performance.
Related articles


