This article first appeared in ETF Insider. To read the full edition, click here.
Concerns about concentration in US equities have been a persistent issue for investors, leading to a shift towards re-allocation strategies. Equal-weighted approaches have gained popularity as a universal solution. However, despite a recent surge in inflows, the tactical investment case remains unproven for now.
Over the past two years, the equal-weighted S&P 500 has underperformed its market-cap weighted counterpart by 13.1%, according to Bloomberg data. A closer examination of allocation and attribution metrics reveals the primary cause of this underperformance: significant differences in sector allocations.
Notably, the largest active weights are in IT (13.9% vs 31.6%) and Industrials (15.9% vs 8.5%). This might suggest two key points for investors: First, Equal Weight should still be viewed as a tactical rotation strategy whose time has yet to come. Second, investors need to pay close attention to sector allocations.
Yet, the devil is in the details, and fortunately for proponents of equal-weight strategies, long-term capital market history tells a different story. Over the past twenty years, the S&P 500 Equal Weight Index has delivered returns comparable to the market-cap weighted version.
Since 1990, it has outperformed the S&P 500 by a notable 63 basis points per year, resulting in a staggering 742% total return difference. Therefore, a strategic rather than tactical perspective may be more needed.
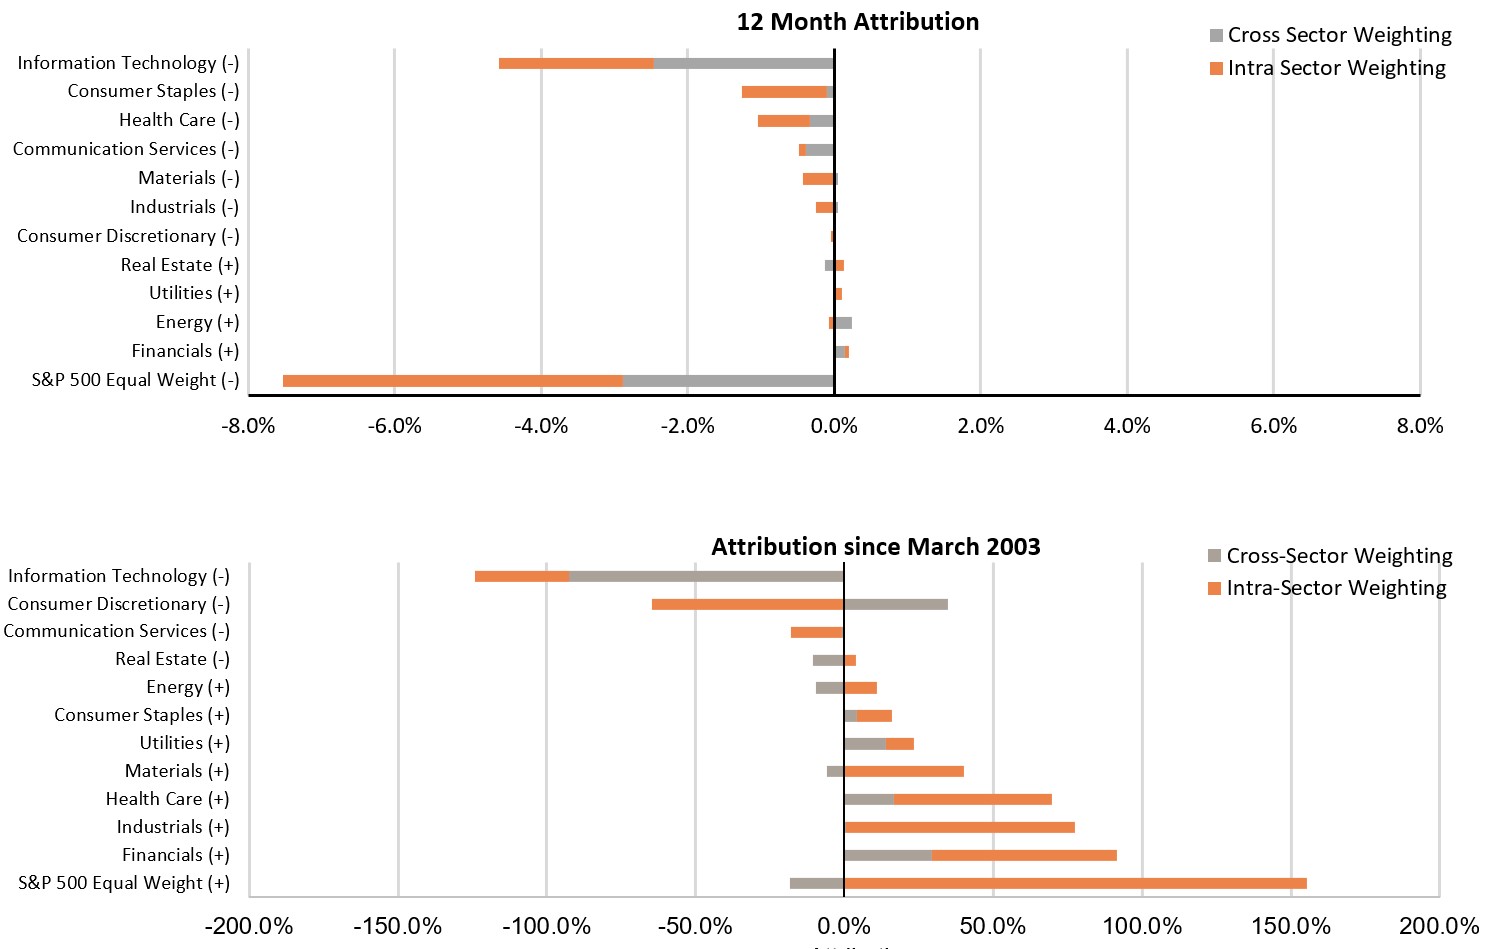
Regarding the underlying performance drivers, a recent attribution analysis by S&P offers valuable insights. Chart 1 illustrates the relative impact of equal weighting within a given sector (in orange) and weighting differences across sectors (in grey) over the past twelve months and since the index’s inception in 2003. This serves as further evidence of how unusual the current times are and provides a powerful warning that recent “winner takes all” dynamics are not just prominent in the tech sector but extend across virtually all sectors.
Chart 1: Attribution Analysis S&P 500 Equal Weight vs. S&P 500

Source: S&P Dow Jones Indices, Factset. Data from March 31st, 2003 to Sept. 30, 2024. Chart is provided for illustrative purposes. Past performance is no guarantee of future results.
The other long-term chart bears another powerful message: it is usually not the top stocks that contribute the most significant returns to the index (especially in non-technology sectors). Instead, a balanced allocation within the sector allows for broader participation and has proven most successful. Simply put, the winners of today are not necessarily the winners of tomorrow.
The implications of these observations for broader investing cannot be overstated at the moment. A lot of investor attention has been on the fact that just a few stocks have outperformed the index, while the rest have trailed. This has made life difficult for many single-stock investors.
However, this is neither unusual when compared to the recent past (on average, only 40% of stocks in the S&P 500 have beaten the index each of the last eight years) nor compared to long-term equity market history, where a tiny 2.4% share of the market is responsible for all net global stock market wealth creation. The unusual aspect is that it is the largest stocks that are doing so.
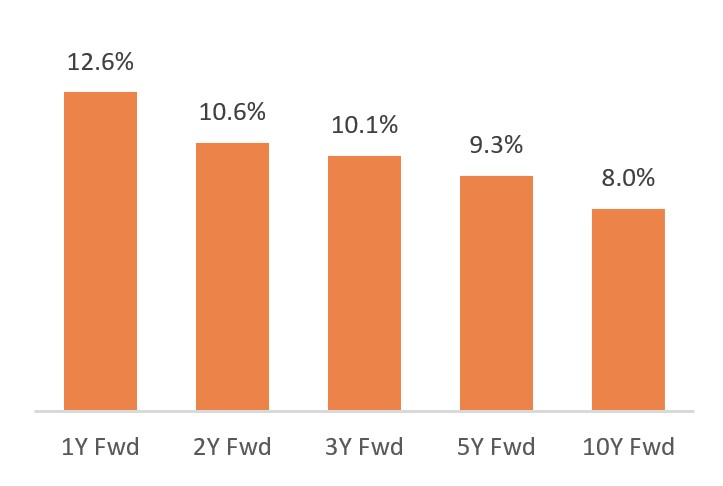
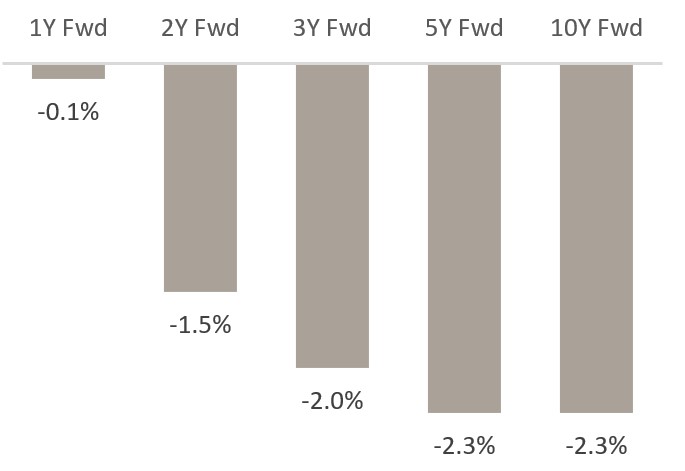
Statistically, top-performing stocks often face relentless disruption, which erodes their future returns. Charts 2.1 and 2.2 illustrate this trend for a sample of the top 10 stocks since the 1980s, highlighting their average forward returns. These returns have consistently declined, and once these stocks reached the top 10, they typically underperformed the index from the first year of their peak ranking.
Chart 2.1: Average forward realized absolute return (US Top 10 companies) since 1980

Chart 2.2: Average forward realized relative return (US Top 10 companies) since 1980

Source: Goldman Sachs, Past performance is not indicative of future returns. As of September 2024
The question now is whether the exception of the last twelve months will indeed last. Depending on the answer, this continues to make a strong case for equal weighted strategies. However, even for market-cap weighted investors, it carries important messages for all areas of the portfolio, beyond US equities.
Most immediately, there is a need to be vigilant about sector exposure. As concentration has increased, the face of many sectors has changed (Chart 1), leading to heightened idiosyncratic risks. Keeping in mind the performance drag that top companies tend to experience, it is crucial to look for new disruptors.
Thematic solutions, particularly those governed by strict diversification constraints, can aim to identify these next disruptors. Especially in fast-changing themes that span several sectors, they are likely to provide more direct access than a sector view alone.
At the same time, with equal weight remaining mostly driven by size and the anti-momentum factor, this highlights the relevance of a factor investing lens in current times. The jitters around the “Magnificent 7” in early August mostly played out via the factor lens, not sectors.
Therefore, scanning portfolios for underlying factor biases, intended or unintentional, is critical. This also puts more emphasis on related factor solutions, especially when blended factor portfolios can offer a more customized tool. The value and quality factors, in particular, warrant a closer look as their combination provides a compelling narrative.
Blending robust fundamentals with attractive valuations can results in a well-diversified solution with more favourable risk-return characteristics than a broad developed markets benchmark. Naturally, a solid factor definition and robust indexing choices are crucial for achieving persistent performance.
At this point, the sector view re-emerges: For Quality and Value in particular, retaining sector weights in line with the benchmark should be a conscious choice to avoid concentrated sector bets, which in turn may turn out to be value traps.
Overall, while winner-takes-all dynamics have produced impressive short-term results, the challenge for investors may remain the same as last year – keeping up with broad benchmark performance while avoiding some idiosyncratic risk and keeping a keen eye on macro drivers that could catalyse the somewhat overdue performance of the average stock.


